


Executive Summary
- Our pulse survey of 150 senior executives across North America, Europe and Asia reveals that supply chain rebalancing is among the top priorities for businesses. As global supply chains evolve, businesses are rebalancing to not only mitigate risks but also capture opportunities.
- High costs and a lack of capabilities are the biggest obstacles to rebalancing. While rebalancing is costly, inaction is costlier.
- The markets that are expected to grow in importance for future supply chains have only small weightings in the global and regional equity market indices. Investors may need to take a more focused approach to exploit the alpha potential from the global rebalancing theme.
Supply chains matter for investors. We have seen how semiconductor chip shortages affected the share prices of automakers in 2022. We have also seen how global supply chain shifts have impacted economies and markets in recent years. The rebalancing of global supply chains is a long-term theme. Our whitepaper provides useful information for global investors looking to learn more about the evolving supply chain landscape and the new investment opportunities arising from these shifts.
We developed a survey-based whitepaper to highlight how business leaders in the automotives, electronics manufacturing, and pharmaceuticals and medical equipment sectors across North America, Europe, and Asia are rebalancing their priorities between driving growth and navigating supply chain issues.
Boosting supply chain resilience is among the top priorities for business leaders across the three sectors
Q. Please rank the following business priorities from the highest to the lowest.
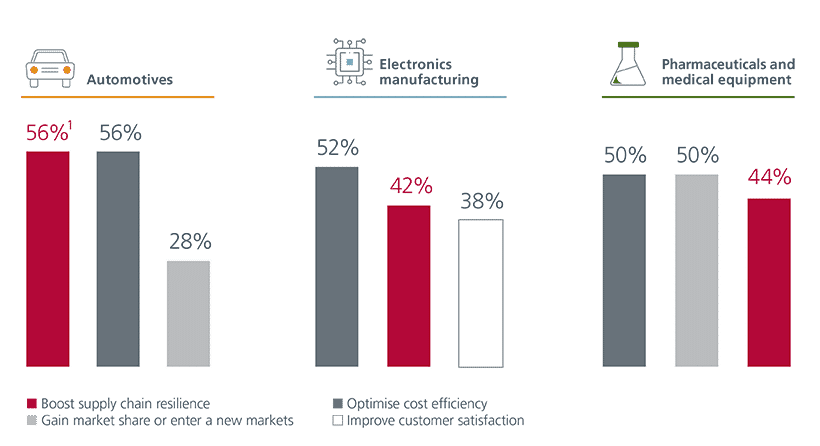 Source of chart: Whitepaper report – The rebalancing roadmap (Pg 19). 1. Percentages indicate the share of business leaders who ranked the given priority among the first or second priorities.
Global supply chain shifts are being driven by key structural factors such as geopolitics, trade disruptions, climate events, and costs. The series of disruptive events since 2020 has however accelerated these shifts and forced businesses to reevaluate their strategic priorities to stay resilient and competitive. Businesses are reevaluating their dependencies on single-supplier or single-market sourcing strategies, which, historically, were cost-effective but have become increasingly fragile.
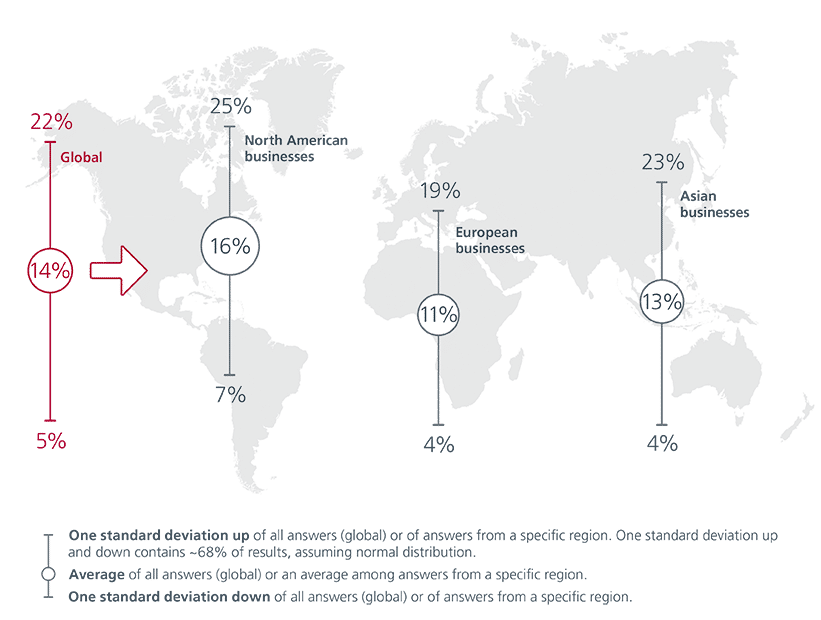
Across the three regions surveyed, rebalancing will be the most expensive for North American businesses
Q. Relative to your company’s average annual revenue over the past 3 years, what percentage must be invested over the medium term (3-5 years) to diversify/rebalance?
 Source of chart: Whitepaper report – The rebalancing agenda (Pg 12).
From investing in new plants to nurturing strategic partnerships with new suppliers, businesses globally are putting in significant efforts to rebalance their supply chains and boost resilience. This structural rewiring of global supply chains is, however, an expensive endeavour. According to our survey, business leaders believe that on average 14% of their company’s annual revenues will have to be invested into rebalancing over the medium term.

Failure to rebalance will have a significant impact on profits
Q. If your company’s current supply chain remains unchanged, what percentage of profit could be negatively impacted / at risk over the following time periods?
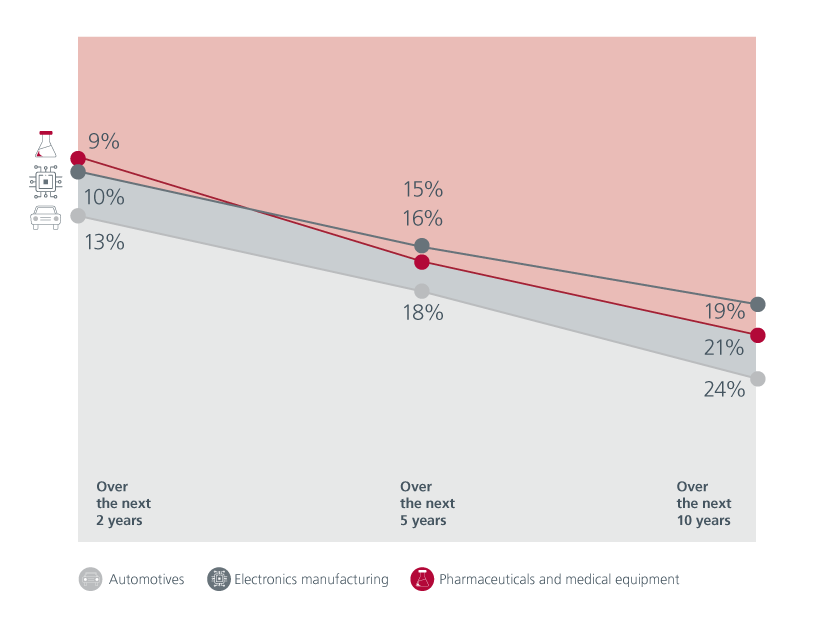 Source of chart: Whitepaper report – The rebalancing roadmap (Pg 20). Percentages indicate the average profit at risk for the sector indicated.
Although the cost of rebalancing is high, 75% of business leaders believe that inaction will cost more than rebalancing. Depending on the sector, failure to rebalance could put 19 –24% of profits at risk over the next 10 years. The biggest obstacles to rebalancing are high costs and a lack of capabilities. Additionally, bureaucratic hurdles, lack of technology, trade rules and supply scarcities also hinder the process.
Supply chain networks are shifting – European businesses are still bullish on Asia
Q. Which are the supply chain locations with the largest increase in importance for businesses (currently and in 5 to 10 years)?
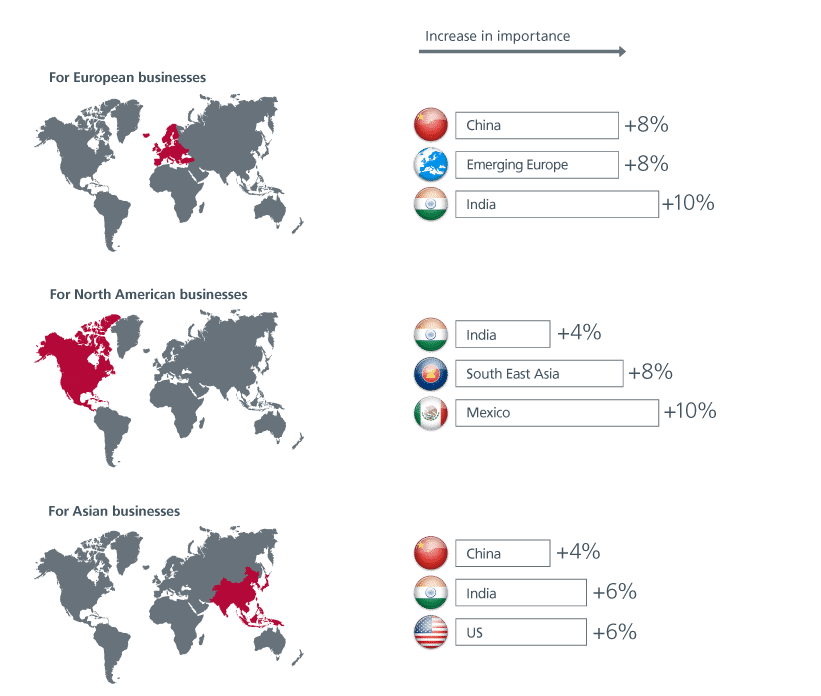 Source of chart: Whitepaper report – The rebalancing agenda (Pg 9). Percentages indicate the changes between now and the future, in the share of business leaders within their respective geography who ranked these markets as either the first or second most important locations for their supply chains.
Although the markets that currently dominate global supply chains i.e. US and China are expected to remain important in the future, their relative importance to different regions will change, mirroring the shift in geopolitical considerations. Our survey shows that India, Mexico, and markets in South East Asia, Emerging Europe and South America are expected to grow in importance for future supply chains.
Investment implications
The markets that are likely to benefit from the global supply chain shifts only have small weightings in the global and regional equity market indices. Emerging Markets (EMs) have a 10% weight in the MSCI AC World Index, while ASEAN accounts for only 1%. Meanwhile, India and ASEAN make up 13% and 6% respectively of the MSCI EM Index.
As such, these market capitalisation-weighted indices only provide modest exposure to the countries that are expected to benefit most from the global supply chain rebalancing. These indices also tend to be biased towards the widely held, larger capitalisation stocks, which potentially reduces diversification and alpha benefits in a portfolio. Therefore, investors may want to consider a more focused approach to exploit the alpha potential from the global rebalancing theme.
This is an extract from our whitepaper “New anchors reshaping supply chains: Opportunities for investors”. Please click here to download the full report.


This material is issued by Eastspring Investments (Hong Kong) Limited ("Eastspring Hong Kong"). This material should not be construed as an offer or solicitation for the subscription, purchase or sale of any securities mentioned herein. Any opinion or estimate contained in this material is subject to change without notice. We have not given any consideration to and we have not made any investigation of the investment objective, financial situation or particular needs of the recipient or any class of persons, and accordingly, no warranty whatsoever is given and no liability whatsoever is accepted for any loss arising whether directly or indirectly as a result of the recipient or any class of persons acting on such information or opinion estimate. Past performance and the predictions, projections, or forecast on the economy, securities markets or the economic trends of the markets are not necessarily indicative of the future or likely performance. Eastspring Investments Hong Kong is an ultimately wholly owned subsidiary of Prudential plc of the United Kingdom. Eastspring Investments Hong Kong and Prudential plc are not affiliated in any manner with Prudential Financial, Inc., a company whose principal place of business is in the United States of America or with the Prudential Assurance Company, a subsidiary of M&G plc, a company incorporated in the United Kingdom. This material and information on our website (www.eastspring.com.hk) are issued by Eastspring Investments (Hong Kong) Limited and have not been reviewed by the Securities and Futures Commission.
Source: MSCI. This material contains information (the “Information”) sourced from MSCI Inc., its affiliates or information providers (the “MSCI Parties”) and may have been used to calculate scores, ratings or other indicators. The Information is for internal use only, and may not be reproduced/redisseminated in any form, or used as a basis for or a component of any financial instruments or products or indices. The MSCI Parties do not warrant or guarantee the originality, accuracy and/or completeness of any data or Information herein and expressly disclaim all express or implied warranties, including of merchantability and fitness for a particular purpose. The Information is not intended to constitute investment advice or a recommendation to make (or refrain from making) any investment decision and may not be relied on as such, nor should it be taken as an indication or guarantee of any future performance, analysis, forecast or prediction. None of the MSCI Parties shall have any liability for any errors or omissions in connection with any data or Information herein, or any liability for any direct, indirect, special, punitive, consequential or any other damages (including lost profits) even if notified of the possibility of such damages.