


Eastspring Investments
Aug 2024 | 5 min read
Executive Summary
- Asia’s growth model has evolved over the last 30 years and the region will continue to transform itself. Historically a fast-growing region, Asia is still expected to contribute to 60% of global growth by 2030.
- Asia has produced disruptors across multiple sectors, presenting investors with greater choice to tap into the region’s growth.
- As the drivers of change accelerate, coupled with the rising complexities of geopolitics, investors will need experience, agility, and deep local insights to invest in a dynamic Asia.
To commemorate Eastspring’s 30th anniversary, we have curated a series of articles that explore Asia's transformation over the last three decades and share insights from our investment teams, gained through years of investing in the region. These articles aim to help investors better appreciate Asia’s growth potential and the investment opportunities in the region. The first article in our series explores how Asia’s changing economic growth model impacts investors.
The Asian economy grew rapidly over the last three decades, with nominal GDP expanding by almost 16x from 1990 to 2022, versus 9x for the global economy1. During this period, demographic shifts, technological advancements, and geopolitical dynamics have shaped Asia’s approach to growth.
Trading places
Asia’s share of the global economy rose from 21% in 1990 to 39% in 20232. Trade has historically been an important growth driver - Asia is the largest trading region in the world, accounting for 35% of world trade in 2020, up from about 20% in 19903. The region’s increasing number of free trade agreements (FTAs) reflects the important role that trade plays. In 2000, only eight FTAs had been signed in Asia Pacific. By 2023, the region had signed 147 agreements, with another 87 under negotiation4.
While trade has remained important, its composition has changed significantly. The share of manufactured goods in Asia’s exports rose from 77% in 1990 to 86% in 2019, alongside the decline in primary goods exports5. That said, the “world’s factory” is relying less on cheap labour to maintain its edge. Asia has moved up the value chain and diversified its industrial base by embracing technological advancements and innovation. As such, Asia today is home to world-class robotics and industrial goods manufacturers, leading semiconductor chip makers, packagers, and integrated circuit design companies. Many companies have also combined their long-established manufacturing edge with new technologies to become major suppliers in the global renewable energy and EV supply chains. This has in turn created diverse opportunities for investors.
Digital technologies have also enabled new forms of cross-border transactions and e-commerce. By 2022, Asia accounted for 51% of global e-commerce sales6, almost double from 2014. This growth has led to the emergence of more Asian-based platform and e-commerce players in recent years.
Fig. 1. How Asia’s trade has evolved
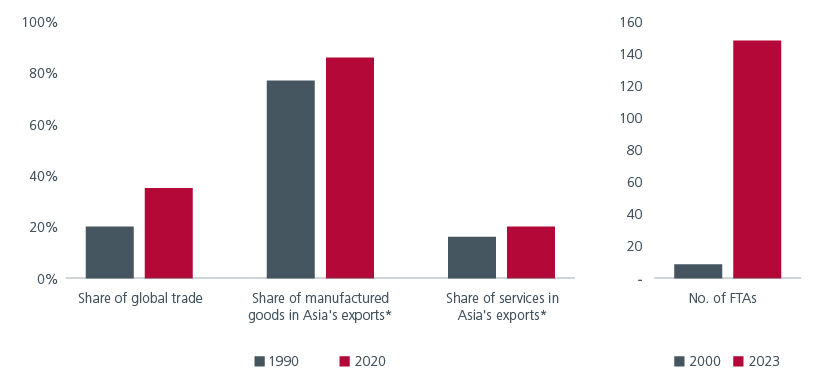
Source: The Evolution of the Global Trading System: How the Rise of Asia and Next Generation Challenges Will Shape the Future Economy. Asia Society Policy Institute. 2022. *Latest data available is 2019.
Given rising geopolitical uncertainty and national security demands, many western countries have been increasingly motivated to strengthen their domestic industries, especially in key sectors such as renewable energy and semiconductors. This will have important trade implications for Asia going forward. On the back of growing US trade restrictions, China is diversifying its export destinations and increasing market shares in ASEAN and Latin America.
The consumer dividend
While trade remains important for the region, Asia’s rapidly growing middle class has made domestic consumption an increasingly important growth driver, especially for India and the southeast Asian economies. Demographics play an important role on this front. According to the OECD, a total fertility rate of 2.1 children per woman ensures a broadly stable population, assuming no net migration and unchanged mortality. Philippines, India, Indonesia, and Vietnam fare well against this benchmark. These countries also have the lowest (old) age dependency ratios7 in the region, which puts less stress on the working population and potentially results in a more balanced distribution of resources. Fig. 2.
Fig. 2 ASEAN and India enjoy favourable demographics
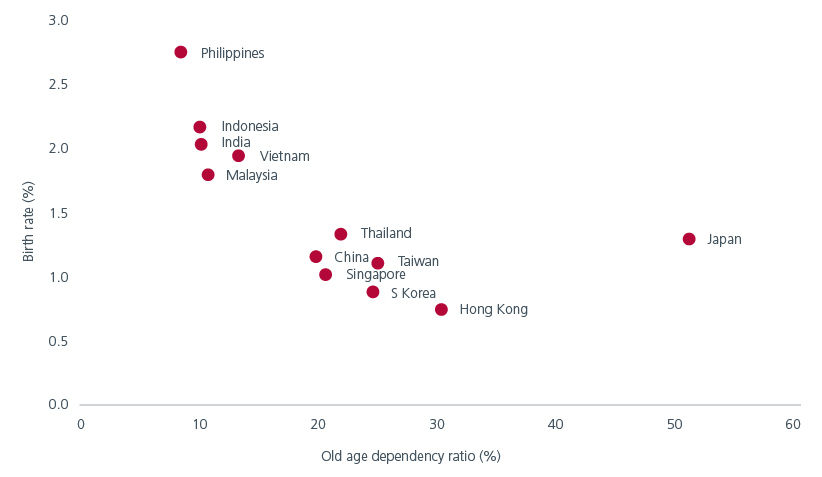
Source: Old age dependency ratios (2022) from World Development indicators. Birth rates (2021) from IMF. All data extracted in January 2024.
India became the world’s most populous country in 2023 and is now poised to become the world’s third largest consumer market by 2027. Meanwhile, ASEAN has the world’s third largest population at 661.8 million. Healthy domestic consumption has helped the ASEAN economies be more resilient during export downturns. Their large domestic consumer markets have also attracted global manufacturers to set up production facilities in the region. The share of intra-regional trade in Asia increased from 42% in 1990 to 53% by 20198. This has benefitted the region with increased investments and employment, and creates investment opportunities in the consumer discretionary, real estate and financial sectors.
A new pecking order?
The economic prominence of the different countries in the region has also evolved over the years. China’s share of the regional economy increased rapidly from less than 10% of Asia’s GDP in 1990 to more than 50% in 2022, after its entry to the World Trade Organisation. Meanwhile, Japan’s share of the region’s GDP has fallen from 60% in 1990 to 13%9. Fig. 3. Accordingly, 162 Japanese companies were represented in the Fortune 500 companies in 1995. By 2023, 137 Chinese and 41 Japanese companies were featured in the list. That said, the fortunes of these two economies continue to evolve. The weakness in China’s real estate sector and weak consumer sentiment have clouded the country’s near-term economic prospects10. On the other hand, Japan’s economic outlook has brightened on the back of rising inflation and corporate reforms.
Fig. 3. Share of Asia GDP
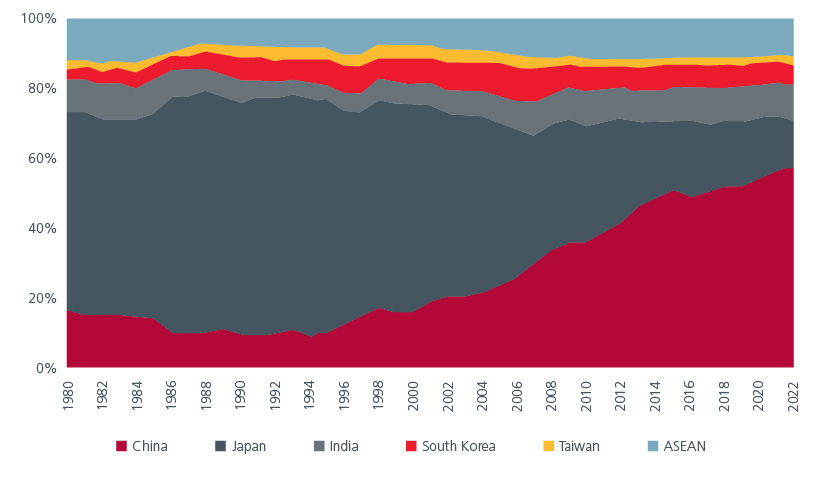
Source: Nominal GDP. Current prices, billions of USD. IMF. Data extracted in January 2024.
Besides China and Japan, the pecking order of the other Asian economies is also evolving. The increased competition amongst the superpowers and the desire by countries to prioritise national security over economic efficiency have caused global supply chains to rebalance, benefiting India and ASEAN. India is expected to be the region’s second largest growth driver in 202411. India’s Production Linked Incentive scheme has helped the country leapfrog basic manufacturing and focus on more advanced manufacturing. Meanwhile, Indonesia is leveraging its large reserves of nickel and cobalt to develop an integrated electric vehicle (EV) supply chain. It aims to become one of the world’s top three producers of EV batteries by 2027. India and Indonesia have made significant progress since 2013, when they were part of the "Fragile Five", a term coined to describe economies that were heavily reliant on volatile foreign investments to finance their growth.
Investing in a dynamic Asia
Asia is expected to contribute to 60% of global growth12 by 2030. Its growth model will continue to evolve as it did over the last 30 years. Asia’s changing landscape has also produced disruptors across different sectors, presenting investors with greater choice to tap into the region’s growth. Going forward, the drivers of change are expected to be accelerate given the growth of digital technologies, the rising importance of sustainability and the increasing complexities of geopolitics13. More than ever, investors will need experience, agility, and deep local insights to invest in a dynamic Asia.
Look out for our next article in this series which will focus on the insights from 30 years of investing in Asia’s bond markets.
Interesting reads


Sources:
1 IMF Datamapper. Data extracted on 5 January 2024. GDP current prices. Asia includes China, Hong Kong, India, Indonesia, Japan, Malaysia, Philippines, South Korea, Singapore, Taiwan and Vietnam.
2 IMF. Data extracted January 2024.
3 The Evolution of the Global Trading System: How the Rise of Asia and Next Generation Challenges Will Shape the Future Economy. Asia Society Policy Institute. 2022.
4 The Evolution of the Global Trading System: How the Rise of Asia and Next Generation Challenges Will Shape the Future Economy. Asia Society Policy Institute. 2022.
5 The Evolution of the Global Trading System: How the Rise of Asia and Next Generation Challenges Will Shape the Future Economy. Asia Society Policy Institute. 2022.
6 Global retail e-commerce revenues. Source: Statista. 2024.
7 World Development indicators. Data extracted in January 2024.
8 IEvolution of the world’s 25 top trading nations. https://unctad.org/topic/trade-analysis/chart-10-may-2021
9 IMF. Nominal GDP (Current prices in USD). Data extracted in January 2024.
10 https://www.worldbank.org/en/news/press-release/2023/12/14/sustained-policy-support-and-deeper-structural-reforms-to-revive-china-s-growth-momentum-world-bank-report
11 Asia outlook 2024. Driving global growth despite risks in China. EIU.
12 https://www.weforum.org/agenda/2019/12/asia-economic-growth/
13 https://www.imf.org/en/News/Articles/2021/09/27/sp092721-the-future-of-finance-and-the-global-economy
Singapore by Eastspring Investments (Singapore) Limited (UEN: 199407631H)
Australia (for wholesale clients only) by Eastspring Investments (Singapore) Limited (UEN: 199407631H), which is incorporated in Singapore, is exempt from the requirement to hold an Australian financial services licence and is licensed and regulated by the Monetary Authority of Singapore under Singapore laws which differ from Australian laws
Hong Kong by Eastspring Investments (Hong Kong) Limited and has not been reviewed by the Securities and Futures Commission of Hong Kong.
Indonesia by PT Eastspring Investments Indonesia, an investment manager that is licensed, registered and supervised by the Indonesia Financial Services Authority (OJK).
Malaysia by Eastspring Investments Berhad (200001028634/ 531241-U) and Eastspring Al-Wara’ Investments Berhad (200901017585 / 860682-K).
Thailand by Eastspring Asset Management (Thailand) Co., Ltd.
United States of America (for institutional clients only) by Eastspring Investments (Singapore) Limited (UEN: 199407631H), which is incorporated in Singapore and is registered with the U.S Securities and Exchange Commission as a registered investment adviser.
European Economic Area (for professional clients only) and Switzerland (for qualified investors only) by Eastspring Investments (Luxembourg) S.A., 26, Boulevard Royal, 2449 Luxembourg, Grand-Duchy of Luxembourg, registered with the Registre de Commerce et des Sociétés (Luxembourg), Register No B 173737.
Chile (for institutional clients only) by Eastspring Investments (Singapore) Limited (UEN: 199407631H), which is incorporated in Singapore and is licensed and regulated by the Monetary Authority of Singapore under Singapore laws which differ from Chilean laws.
The afore-mentioned entities are hereinafter collectively referred to as Eastspring Investments.
The views and opinions contained herein are those of the author, and may not necessarily represent views expressed or reflected in other Eastspring Investments’ communications. This document is solely for information purposes and does not have any regard to the specific investment objective, financial situation and/or particular needs of any specific persons who may receive this document. This document is not intended as an offer, a solicitation of offer or a recommendation, to deal in shares of securities or any financial instruments. It may not be published, circulated, reproduced or distributed without the prior written consent of Eastspring Investments. Reliance upon information in this document is at the sole discretion of the reader. Please carefully study the related information and/or consult your own professional adviser before investing.
Investment involves risks. Past performance of and the predictions, projections, or forecasts on the economy, securities markets or the economic trends of the markets are not necessarily indicative of the future or likely performance of Eastspring Investments or any of the funds managed by Eastspring Investments.
Information herein is believed to be reliable at time of publication. Data from third party sources may have been used in the preparation of this material and Eastspring Investments has not independently verified, validated or audited such data. Where lawfully permitted, Eastspring Investments does not warrant its completeness or accuracy and is not responsible for error of facts or opinion nor shall be liable for damages arising out of any person’s reliance upon this information. Any opinion or estimate contained in this document may subject to change without notice.
Eastspring Investments companies (excluding joint venture companies) are ultimately wholly owned/indirect subsidiaries of Prudential plc of the United Kingdom. Eastspring Investments companies (including joint venture companies) and Prudential plc are not affiliated in any manner with Prudential Financial, Inc., a company whose principal place of business is in the United States of America or with the Prudential Assurance Company Limited, a subsidiary of M&G plc (a company incorporated in the United Kingdom).