

Pierre-Julien Jandrain
Head of Portfolio Risk Management
Eastspring Investments
Oct 2024 | 5 min read

Rong Ren Goh
Portfolio Manager, Head of Macro and Thematics,
Asian Fixed Income,
Eastspring Investments
Executive Summary
- Similar portfolio duration does not necessarily lead to similar volatility risk
- Duration risk assessment is likely to be more accurate via a granular approach
- Proprietary duration metrics can better capture long-term relationships between tenors and currencies, and help investors to invest with confidence throughout the full monetary cycle
Modified duration, often simply referred as duration, is the measure of a bond’s price sensitivity to interest rate changes. Duration is expressed in years because for a fixed-rate bond, it is mainly a function of the residual maturity of the bond, which is also expressed in years. There is an inverse relationship between the change in bond prices and the change in bond yields; higher bond yields result in lower bond prices, and the longer the bond duration the more severe the bond price decline in response to a 1% increase in bond yields.
1. Do similar durations bear similar risk?
Not necessarily the case. For example, short-term interest rates tend to rise faster than longer-term rates, and they tend to exhibit higher volatility during a monetary tightening cycle than in stable market conditions. As such, a certain amount of duration from a bond maturing in two years versus the same amount of duration from another bond maturing in ten years can exhibit different volatilities. Fig 1. The relative volatility of 2-year bond yields versus 10-year bond yields is typically a function of the stage of the monetary cycle.
Fig 1: Yield volatility of US 2-year government bonds vs US 10-year government bonds
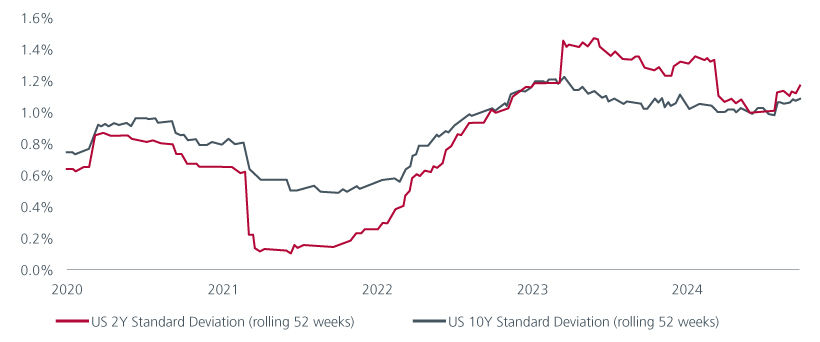
Source: Bloomberg and Eastspring Investments as of 20 Sep 2024
2. Does a bond’s currency denomination impact yield volatility?
It certainly does. In Fig 2, we can see that the volatility of Singapore 10-year government bond yields was on par with the volatility of US 10-year government bond yields during the 18 months following the start of the Covid-19 pandemic. This was when global central banks including the US Federal Reserve and the Monetary Authority of Singapore provided synchronised monetary stimulus that kept interest rates low. However, in the pre and post Covid-19 period, US bond yields were consistently more volatile than Singapore bond yields amid less synchronized global monetary policies.
Fig 2: Yield volatility for US 10-year bonds vs Singapore 10-year bonds
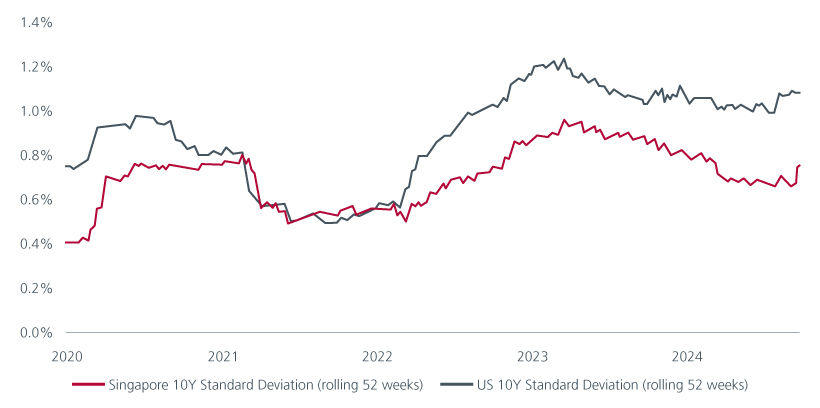
Source: Bloomberg and Eastspring Investments as of 20 Sep 2024
3. Can you illustrate how duration is conventionally used to measure portfolio risk?
The utility of duration is well captured in our Asian bond strategies which hold both US dollar and Asian local currency bonds. Typically, when we construct a bond portfolio, we match the risk characteristics of the benchmark index, plus/minus active positions that we think will help a strategy outperform the index. Usually, the strategy tends to have a duration profile that is comparable to the benchmark.
In Fig 3, you can see that one particular strategy had an overall duration of 4.8 years with 3.35 years coming from US dollar bonds and the rest from Asia local currency bonds. The benchmark index, which is 100% in US dollar bonds, had a duration of 4.45 years. The active duration, the difference between the portfolio duration and the benchmark duration, is 0.35 years with a duration overweight in Asia local currencies, especially in Singapore dollar, and a duration underweight in US dollar.
Fig 3: Duration breakdown by currency
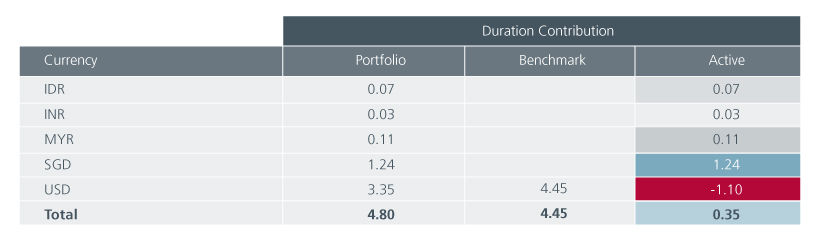
Source: Eastspring Investments as at end Dec 2023
In Fig 4, we decompose the portfolio, benchmark and active durations by residual maturity; the portfolio has an overweight to intermediate and long maturities and an underweight to short-dated bonds. The total active duration is the same as in Fig 3 (0.35 years), but we use a different dimension to decompose the number i.e. residual maturity as opposed to currency.
Fig 4: Duration breakdown by residual maturity
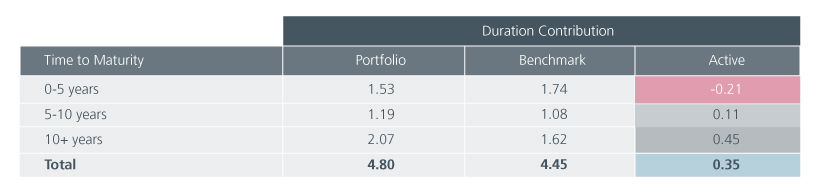
Source: Eastspring Investments as at end Dec 2023
As per the above duration breakdown examples, looking only at the headline active duration number can lead one to conclude that the strategy is unequivocally bullish due to the duration overweight. Such a conclusion would be incorrect, and a more granular approach is required.
4. Are there more dimensions that need to be considered in your interest rate risk assessment?
As we saw from historical volatility charts, one unit of duration risk from a single bond may result in more or less volatility risk depending on the time to maturity1, the stage of the monetary cycle and the bond’s currency.
By adjusting for volatilities and correlations between tenors and currencies, one can better assess the risk of the portfolio, particularly its risk relative to the benchmark index. Ignoring those relationships may lead you to ill-informed investment decisions such as having excessive interest rate sensitivity or lacking that interest rate sensitivity.
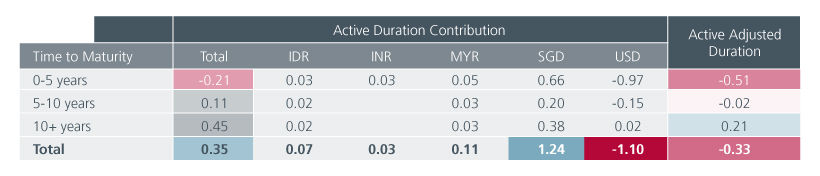
In Fig 5, we show how the active duration can change from a positive number (+0.35) when using the conventional duration measure, which we discussed previously, to a negative number (-0.33) after adjusting for long-term volatilities and correlations between tenors and countries.
The negative adjusted duration is mainly driven by the strategy’s allocation to Singapore dollar-denominated bonds, at the expense of US dollar-denominated bonds, given the relatively lower volatility of Singapore government bond yields vs the US government bond yields as we saw earlier.
Fig. 5 : Conventional duration versus beta-adjusted duration
Source: Eastspring Investments as at end Dec 2023
Our proprietary adjusted duration measures are typically calibrated using long-term covariances to better capture expected relationships between tenors and currencies over a full economic cycle. This means that assuming those long-term relationships hold, the above-mentioned strategy is actually more defensive (-0.33) than what the conventional active duration measure (+0.35) suggests.
5. Given that Fed has begun easing, how is duration shaping your portfolios?
Over the past year, USD rate volatility has increased significantly. Market participants initially anticipated policy easing from the Fed, only to recalibrate their expectations in response to prevailing US economic conditions, which influenced the Fed’s policy trajectory. The resilience of the US labour market and persistent inflation in the services sector have particularly complicated the long-duration trade—traditionally seen as a strategy to capitalise on rate rallies when the Fed begins easing.
Duration in other currency markets is expected to perform well alongside USD duration as the Fed cuts rates or signals an upcoming cut. Investing in the duration of these markets offers the added benefit of reducing portfolio volatility when expressing a policy easing view, which can be advantageous given that the rate trajectory may not follow a linear path.
As we incorporate non-USD duration into our portfolios to reflect our constructive duration outlook, a beta-adjusted duration analysis provides a more precise way to assess volatility contributions. This approach will support active rebalancing as market conditions evolve.
Access expert analysis to help you stay ahead of markets.
- Follow


Interesting reads


Sources:
1 Refers to fixed-rate bonds
Singapore by Eastspring Investments (Singapore) Limited (UEN: 199407631H)
Australia (for wholesale clients only) by Eastspring Investments (Singapore) Limited (UEN: 199407631H), which is incorporated in Singapore, is exempt from the requirement to hold an Australian financial services licence and is licensed and regulated by the Monetary Authority of Singapore under Singapore laws which differ from Australian laws
Hong Kong by Eastspring Investments (Hong Kong) Limited and has not been reviewed by the Securities and Futures Commission of Hong Kong.
Indonesia by PT Eastspring Investments Indonesia, an investment manager that is licensed, registered and supervised by the Indonesia Financial Services Authority (OJK).
Malaysia by Eastspring Investments Berhad (200001028634/ 531241-U) and Eastspring Al-Wara’ Investments Berhad (200901017585 / 860682-K) and has not been reviewed by Securities Commission of Malaysia.
Thailand by Eastspring Asset Management (Thailand) Co., Ltd.
United States of America (for institutional clients only) by Eastspring Investments (Singapore) Limited (UEN: 199407631H), which is incorporated in Singapore and is registered with the U.S Securities and Exchange Commission as a registered investment adviser.
European Economic Area (for professional clients only) and Switzerland (for qualified investors only) by Eastspring Investments (Luxembourg) S.A., 26, Boulevard Royal, 2449 Luxembourg, Grand-Duchy of Luxembourg, registered with the Registre de Commerce et des Sociétés (Luxembourg), Register No B 173737.
Chile (for institutional clients only) by Eastspring Investments (Singapore) Limited (UEN: 199407631H), which is incorporated in Singapore and is licensed and regulated by the Monetary Authority of Singapore under Singapore laws which differ from Chilean laws.
The afore-mentioned entities are hereinafter collectively referred to as Eastspring Investments.
The views and opinions contained herein are those of the author, and may not necessarily represent views expressed or reflected in other Eastspring Investments’ communications. This document is solely for information purposes and does not have any regard to the specific investment objective, financial situation and/or particular needs of any specific persons who may receive this document. This document is not intended as an offer, a solicitation of offer or a recommendation, to deal in shares of securities or any financial instruments. It may not be published, circulated, reproduced or distributed without the prior written consent of Eastspring Investments. Reliance upon information in this document is at the sole discretion of the reader. Please carefully study the related information and/or consult your own professional adviser before investing.
Investment involves risks. Past performance of and the predictions, projections, or forecasts on the economy, securities markets or the economic trends of the markets are not necessarily indicative of the future or likely performance of Eastspring Investments or any of the funds managed by Eastspring Investments.
Information herein is believed to be reliable at time of publication. Data from third party sources may have been used in the preparation of this material and Eastspring Investments has not independently verified, validated or audited such data. Where lawfully permitted, Eastspring Investments does not warrant its completeness or accuracy and is not responsible for error of facts or opinion nor shall be liable for damages arising out of any person’s reliance upon this information. Any opinion or estimate contained in this document may subject to change without notice.
Eastspring Investments companies (excluding joint venture companies) are ultimately wholly owned/indirect subsidiaries of Prudential plc of the United Kingdom. Eastspring Investments companies (including joint venture companies) and Prudential plc are not affiliated in any manner with Prudential Financial, Inc., a company whose principal place of business is in the United States of America or with the Prudential Assurance Company Limited, a subsidiary of M&G plc (a company incorporated in the United Kingdom).