Summary
“The whole is greater than the sum of its parts” – Aristotle
Aristotle's famous quote indicates the essence of successful investment strategies. It acknowledges the fact that the total effect of integrated elements often generates superior outcomes compared to the added contributions of each isolated component.
This holistic view recognises the value of interactions between parts and hence fundamentally resonates with the principles of multi-factor investing. In addition, this perspective also underpins the concept of diversification more generally, which in the current environment deserves more attention in investment portfolios.
Unveiling concentration risk
Financial markets have witnessed a tumultuous first half of 2023, characterised by a range of notable events. From a surge in tech stocks driven by artificial intelligence (AI), to market volatility in commodities and cryptocurrencies, and even a severe banking crash reminiscent of the Lehman Brothers collapse. However, what sets this period apart is the persistent rise in interest rates, which has been a departure from the market conditions experienced in 2022.
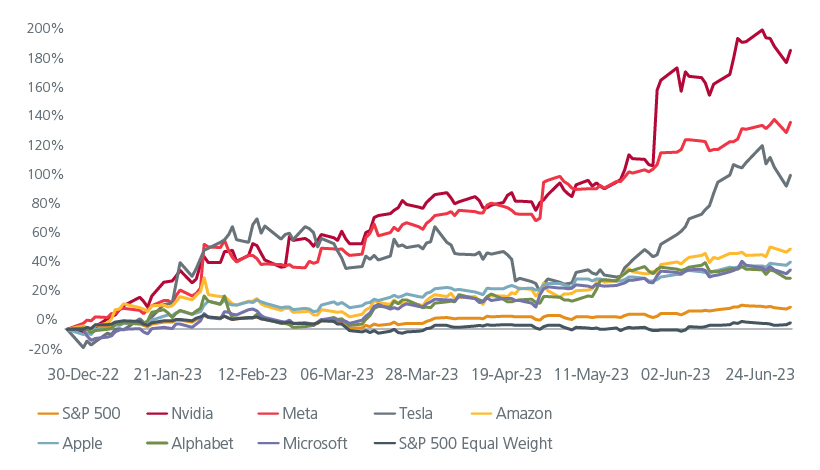
Despite the challenging environment, global stocks, as measured by the MSCI ACWI, have managed to rally by approximately 14%. 1 Yet, this rally has been accompanied by a significant concentration of value appreciation within specific sectors. The AI boom, buoyed in part by advancements in technology like ChatGPT, has pushed the "Mega Tech" giants such as Apple, Microsoft, Alphabet (Google's parent company), Amazon, and Netflix to impressive gains of 35% to 50%, as shown in Fig 1.
Notably, Meta and Tesla have more than doubled in value, while the soaring demand for semiconductor chips driven by AI applications has catapulted Nvidia's stock price by a staggering 185%, briefly propelling it into the exclusive club of U.S. companies with a market value surpassing $1 trillion.
Fig 1: The magnificent seven dominated the upside
Source: Refinitiv Eikon, S&P Global, and Eastspring Investments, June 2023
This prevailing trend of mega-cap stocks dominating the market significantly amplifies the concentration risk within the equity market. Consequently, there is a heightened level of risk associated with the market due to its concentrated nature.
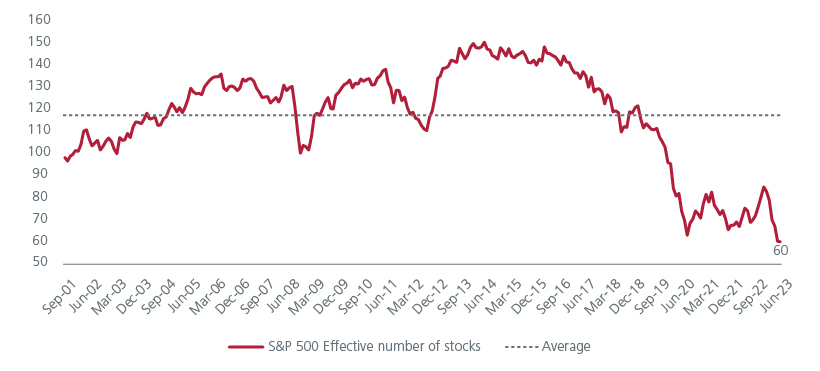
To quantify the extent of market concentration, we can utilise the concept of the effective number of stocks. This metric provides a simple measure of index concentration, ranging from 1 (indicating complete concentration in a single stock) to N, representing the total number of constituents in the index. A low effective number of constituents indicates a high level of index concentration.
Notably, as shown in Fig 2, the effective number of companies within the S&P 500 index has witnessed a persistent decline since March 2018, reaching an unprecedented low of only 60 effective stocks by June 2023. This level is significantly below the pre-pandemic low of 96 recorded during the dot-com bubble period, highlighting a reduced level of diversification, and underscoring the critical need to evaluate concentration risks meticulously.
Fig 2: Historical low hit of effective number of stocks
Source: Bloomberg, S&P Dow Jones Indices, and Eastspring Investments
Recognising the concentration risk, market cap index providers have taken action. For example, the Nasdaq-100 Index, the underlying index for Invesco QQQ Trust (QQQ), the world's fifth-largest exchange-traded fund (ETF), underwent a special rebalance on July 24.
This rebalance aimed to address the over-concentration of the index, particularly among the "Magnificent Seven" companies, including Microsoft, Apple, NVIDIA, Amazon, Tesla, Meta Platforms, and Alphabet, which collectively represent nearly 55% of the index as of June 2023.
The special rebalance did not involve the removal or addition of securities but instead focused on reducing the index's concentration in its largest constituents. This move serves as a reminder of the risks associated with over-reliance on a narrow market leadership.
The enduring importance of diversification
Diversification, as advocated by Harry Markowitz's renowned statement that "Diversification is the only free lunch," plays a crucial role in managing risk and optimising portfolio performance. In 1952, Harry Markowitz revolutionised the field of portfolio management with his dissertation on "Portfolio Selection2 ," which laid the foundation for Modern Portfolio Theory. His insights highlighted the goal of maximising returns for a given level of risk, achieved through the incorporation of less correlated securities into a portfolio. Markowitz's ground-breaking formula enabled investors to mathematically balance risk tolerance and reward expectations, ultimately constructing an optimal portfolio.
While the benefits of diversification have long been recognised across individual stocks and asset classes, the concept extends beyond these boundaries. With the development of financial literature and theoretical frameworks, such as Robert C. Merton's Intertemporal Capital Asset Pricing Model (ICAPM)3 , the focus shifted towards diversification among factors. This evolution facilitated the emergence of multi-factor investing, allowing investors to enjoy the benefits of factor exposure while reducing overall deviation from the benchmark.
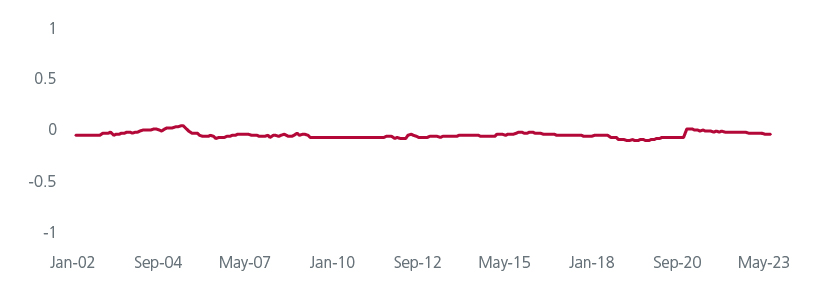
In a multi-factor equity investment strategy, the focus lies in selecting factors with low correlations to each other, ensuring enhanced diversification and potential risk reduction within the portfolio. In Fig. 3 (shown at the end of this article) and Fig. 4, we have presented a group of well-established risk premium factors (with our own enhanced definition). These factors make up a diverse collection of stock return drivers that are not strongly correlated with each other (Fig. 3), as indicated by the average pairwise correlation of their returns over a 3-year rolling period in Fig. 4.
Fig 4: 3-year rolling average pairwise correlation of factor returns
Source: Bloomberg, S&P Dow Jones Indices, Refinitiv, and Eastspring Investments
Building in resiliency to the cyclicality of individual factors
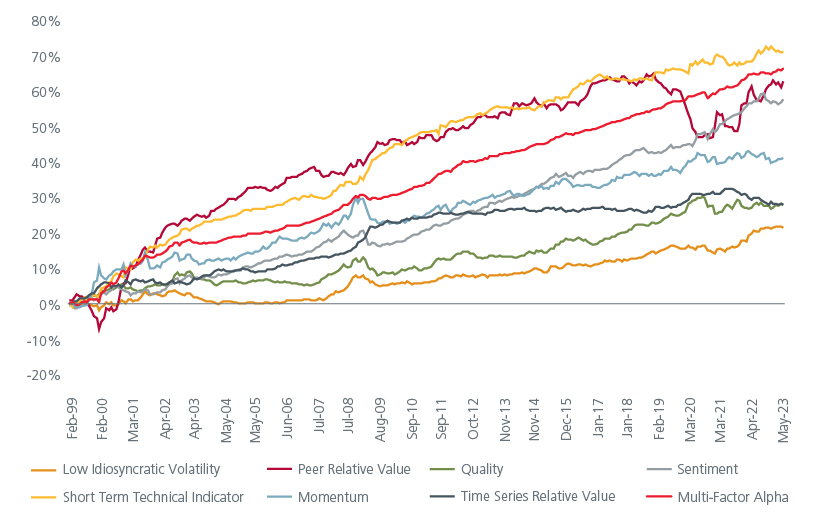
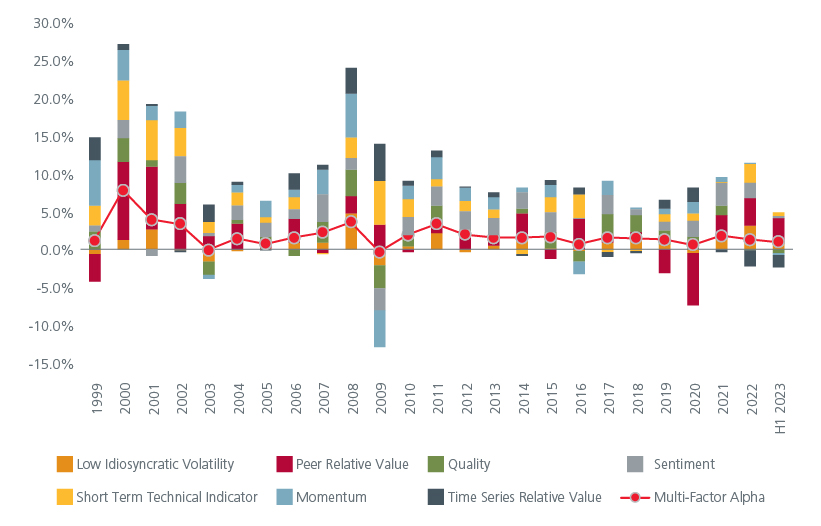
Factors such as Value, Quality, Momentum, and Low Volatility offer distinct return characteristics, enabling investors to capture broader market trends. While we expect our individual alpha factors to generate long-term returns, as illustrated in Fig 5, it is important to note that they may exhibit cyclical performance in the short term. However, the short-term returns of these factors do not move together due to their contrasting exposure to the economic cycles. Fig 6.
By targeting a broad exposure to cyclical, defensive, and dynamic factors, a well-formed multi-factor strategy benefits from diversification, enabling participation in the long-term outperformance of individual factors while mitigating the cyclicality associated with each factor. With a multi-factor strategy, investors not only gain exposure to various investment themes but also mitigate the concentration risk associated with relying on a single factor. This approach allows for the benefits of factor investing while effectively managing deviations from the benchmark.
Fig 5: Single factors’ long-term performance
Source: Bloomberg, S&P Dow Jones Indices, Refinitiv, and Eastspring Investments
Fig 6: Multi-factors’ long-term performance
Source: Bloomberg, S&P Dow Jones Indices, Refinitiv, and Eastspring Investments
Capture diversification benefits via multi-factor strategies
In the current market environment, where a narrow market rally driven by specific themes can lead to increased vulnerability, the need for diversification through multi-factor equity investing is paramount. Combining the wisdom of Aristotle, the insights of Markowitz, and a comprehensive understanding of the market landscape, investors can construct portfolios that capture the benefits of diversification and position themselves for long-term success.
By embracing a diversified approach, investors can navigate uncertainties, mitigate risk, and unlock the full potential of their investment strategies in the pursuit of sustainable returns.
Fig 3: 3-year rolling factor return pairwise correlations
Low volatility vs other factors
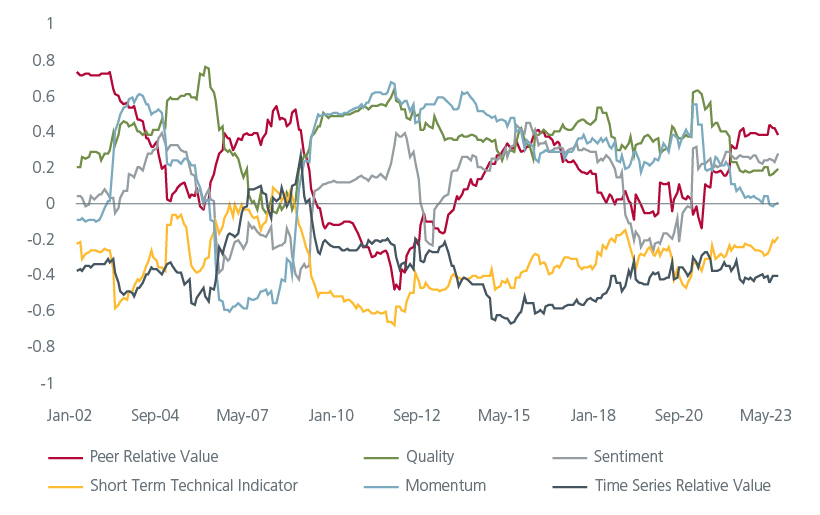
Peer relative value vs other factors
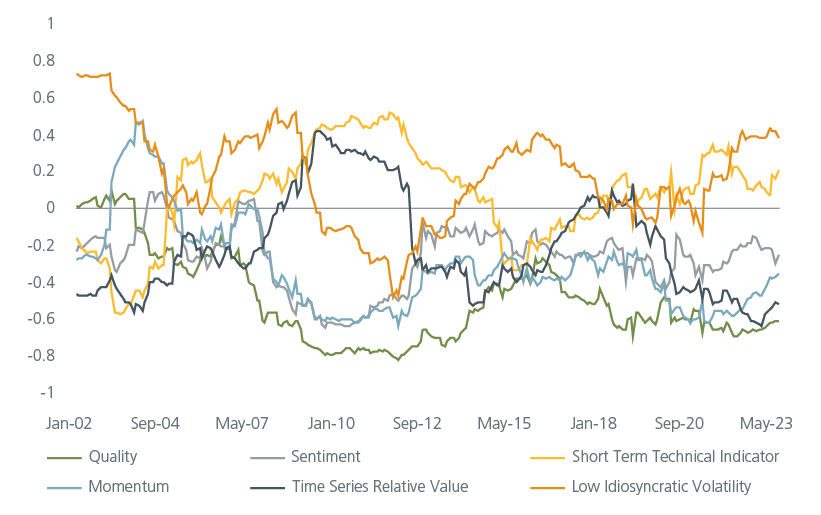
Quality vs other factors
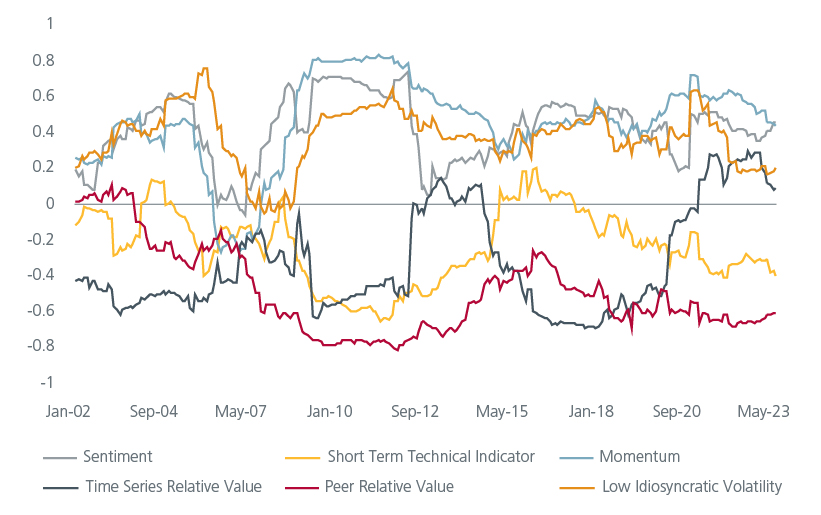
Sentiment vs other factors
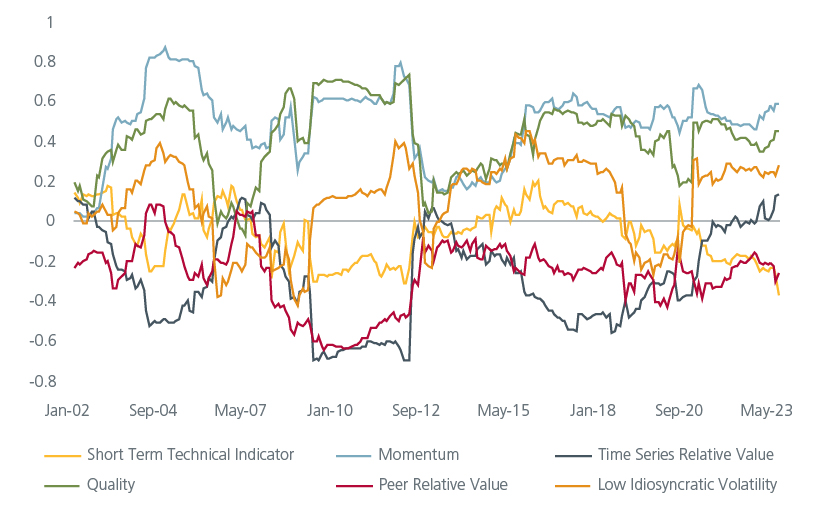
Short-term technical vs other factors
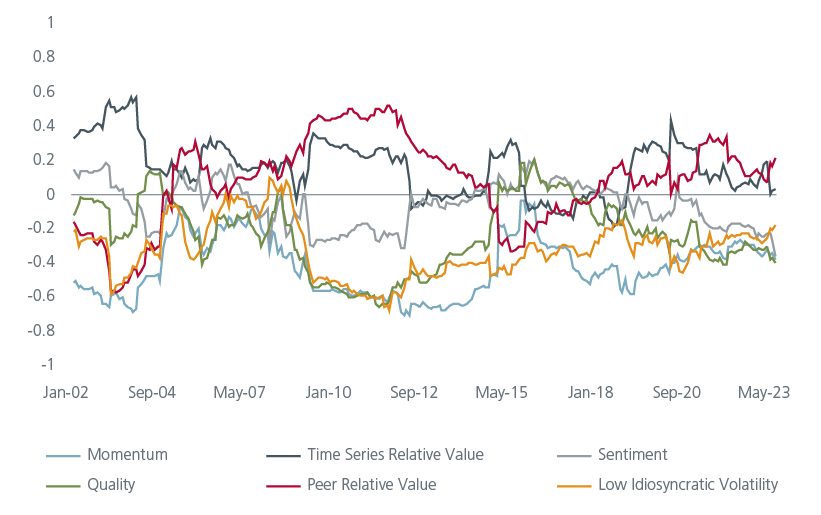
Momentum vs other factors
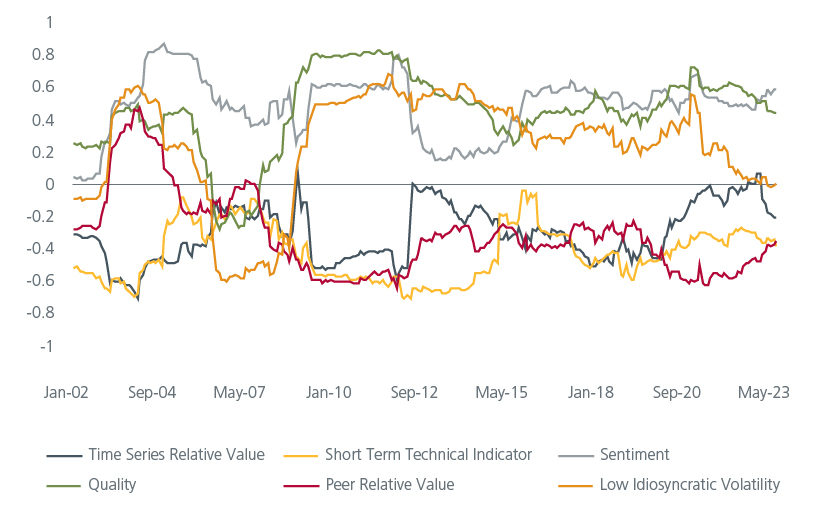
Source: Bloomberg, S&P Dow Jones Indices, Refinitiv, and Eastspring Investments
Access expert analysis to help you stay ahead of markets.
Sources:
1 As at Jun 2023
2 Markowitz, H. (1952). Portfolio Selection. Journal of Finance, 7(1), 77–91.
3 Merton, Robert C. "An Intertemporal Capital Asset Pricing Model." Econometrica 41, no. 5 (September 1973): 867–887. (Chapter 15 in Continuous-Time Finance.)
Singapore by Eastspring Investments (Singapore) Limited (UEN: 199407631H)
Australia (for wholesale clients only) by Eastspring Investments (Singapore) Limited (UEN: 199407631H), which is incorporated in Singapore, is exempt from the requirement to hold an Australian financial services licence and is licensed and regulated by the Monetary Authority of Singapore under Singapore laws which differ from Australian laws
Hong Kong by Eastspring Investments (Hong Kong) Limited and has not been reviewed by the Securities and Futures Commission of Hong Kong.
Indonesia by PT Eastspring Investments Indonesia, an investment manager that is licensed, registered and supervised by the Indonesia Financial Services Authority (OJK).
Malaysia by Eastspring Investments Berhad (200001028634/ 531241-U) and Eastspring Al-Wara’ Investments Berhad (200901017585 / 860682-K) and has not been reviewed by Securities Commission of Malaysia.
Thailand by Eastspring Asset Management (Thailand) Co., Ltd.
United States of America (for institutional clients only) by Eastspring Investments (Singapore) Limited (UEN: 199407631H), which is incorporated in Singapore and is registered with the U.S Securities and Exchange Commission as a registered investment adviser.
European Economic Area (for professional clients only) and Switzerland (for qualified investors only) by Eastspring Investments (Luxembourg) S.A., 26, Boulevard Royal, 2449 Luxembourg, Grand-Duchy of Luxembourg, registered with the Registre de Commerce et des Sociétés (Luxembourg), Register No B 173737.
Chile (for institutional clients only) by Eastspring Investments (Singapore) Limited (UEN: 199407631H), which is incorporated in Singapore and is licensed and regulated by the Monetary Authority of Singapore under Singapore laws which differ from Chilean laws.
The afore-mentioned entities are hereinafter collectively referred to as Eastspring Investments.
The views and opinions contained herein are those of the author, and may not necessarily represent views expressed or reflected in other Eastspring Investments’ communications. This document is solely for information purposes and does not have any regard to the specific investment objective, financial situation and/or particular needs of any specific persons who may receive this document. This document is not intended as an offer, a solicitation of offer or a recommendation, to deal in shares of securities or any financial instruments. It may not be published, circulated, reproduced or distributed without the prior written consent of Eastspring Investments. Reliance upon information in this document is at the sole discretion of the reader. Please carefully study the related information and/or consult your own professional adviser before investing.
Investment involves risks. Past performance of and the predictions, projections, or forecasts on the economy, securities markets or the economic trends of the markets are not necessarily indicative of the future or likely performance of Eastspring Investments or any of the funds managed by Eastspring Investments.
Information herein is believed to be reliable at time of publication. Data from third party sources may have been used in the preparation of this material and Eastspring Investments has not independently verified, validated or audited such data. Where lawfully permitted, Eastspring Investments does not warrant its completeness or accuracy and is not responsible for error of facts or opinion nor shall be liable for damages arising out of any person’s reliance upon this information. Any opinion or estimate contained in this document may subject to change without notice.
Eastspring Investments companies (excluding joint venture companies) are ultimately wholly owned/indirect subsidiaries of Prudential plc of the United Kingdom. Eastspring Investments companies (including joint venture companies) and Prudential plc are not affiliated in any manner with Prudential Financial, Inc., a company whose principal place of business is in the United States of America or with the Prudential Assurance Company Limited, a subsidiary of M&G plc (a company incorporated in the United Kingdom).


