
in better income – encapsulates how investors should look beyond income payouts and consider investments that offer growth potential in up markets and stability in down markets, to build a resilient portfolio that delivers stable returns over time.
Embrace income investing in today's volatile markets, where falling rates and traditional yield opportunities are dwindling. Our Portfolio Manager reveals how a well-balanced, style-agnostic portfolio can offer stability and resilience through an income strategy that invests in companies across the dividend journey.
Investors may enjoy better income with 6% p.a.* payouts and long-term capital growth by investing in companies across the dividend journey in the Asia Pacific ex Japan region.
Footnote:
* (p.a.): per annum. For distributing share classes (monthly distribution): USD ADM, SGD ASDM.
^ Distributions are not guaranteed and may fluctuate. Distribution payouts can be made out of (a) income; or (b) net capital gains; or (c) capital of the Fund or a combination of any of (a) and/or (b) and/or (c).
Discover our income funds
Better income isn’t just about payouts – it’s about achieving potential growth in up markets, and stability in down markets, to build resilient portfolios that deliver stable returns over time. Explore our income funds designed to meet your investment goals.
-

in better income
Eastspring Investments - Asia ESG Bond Fund -

in better income
Eastspring Investments - Asian Low Volatility Equity Fund
Ready to invest?
Click here to contact our distribution partners for the availability and information of our funds.
Fund objective
-
SGD 10.630
NAV as of 11 Mar 2025
-
$-0.03

Daily $ Change
-
-0.24 %
Daily % Change
-
Morningstar rating

Fund performance
Fund returns
All data as at 31 January 2025
| 1 m | 3 m | YTD | 1 y | 3 y (p.a) |
5 y (p.a) |
10 y (p.a) |
Since inception (p.a) |
|
|---|---|---|---|---|---|---|---|---|
| Bid-Bid | 1.2% | -1.7% | 1.2% | 12.4% | -2.6% | -0.4% | 0.1% | 0.4% |
| Offer-Bid | -3.9% | -6.6% | -3.9% | 6.8% | -4.3% | -1.4% | -0.4% | 0.0% |
| Benchmark | 1.2% | -2.5% | 1.2% | 14.8% | -0.9% | 2.6% | 3.8% | 3.4% |
(p.a.): per annum. Source: Eastspring Investments (Singapore) Limited. Returns are based in share class currency and computed on bid-bid basis with net income reinvested, if any. Offer-bid is inclusive of sales charge which is subject to changes. Since inception returns for periods less than a year are not annualised. The benchmark for the hedged share classes, if any, is also calculated on a hedged basis. Calendar year returns are based on the share class performance for the year, and if the share class was incepted during a particular year, the returns shown relate to the performance of the share class since its inception to the end of that calendar year. Wef July 2018, the monthly fund and benchmark returns calculated are aligned to the last NAV date of the fund for the month. Past performance information presented is not indicative of future performance.
Portfolio Manager
-

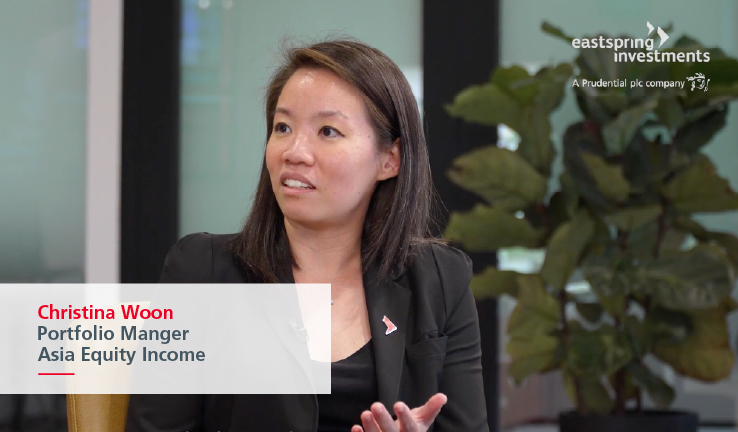
Christina Woon
Portfolio Manager
Christina Woon is a Portfolio Manager and Head of the Asia Equity Income team. She is primarily responsible for the management of our Asian Equity Income strategy. Christina has over 11 years of investment experience and holds a Bachelor of Accountancy from Singapore Management University and is a CFA Charterholder.
Fund facts
- Asset classEquity
- ClassAS (hedged)
- Subscription methodCash,SRS
- ISIN codeLU0865486749
- Bloomberg tickerESAEASH LX
- Minimum initial investmentSGD 1,000+
- Minimum subsequent investmentSGD 100
- Inception date 02 Jan 2013
- Share class currencySGD
- Initial sales chargeMax 5%
- Annual management fees1.5%
- Benchmark indexMSCI AC Asia Pacific ex Japan (SGD hedged)
- Morningstar rating *
Footnote: + Subject to Distributor's terms and conditions.
*Rating should not be taken as recommendation. © 2025 Morningstar, Inc. All rights reserved. The information contained herein: (1) is proprietary to Morningstar and/or its content providers; (2) may not be copied or distributed; and (3) is not warranted to be accurate, complete, or timely. Neither Morningstar nor its content providers are responsible for any damages or losses arising from any use of this information. Past performance is no guarantee of future results.
in insights