Executive Summary
- Fundamentals of Emerging Market economies are looking better which suggests that credit rating upgrades are likely for some, a positive for GEM bonds.
- Emerging Market debt yields have risen to 10-year highs which provides sufficient buffer for any market volatility arising from geopolitical risks.
- Improving credit quality and Fed rate cuts will trigger a reversal of funds flows from Developed to Emerging Markets. Even if a small portion of the USD6 trillion money market funds in the US flows to GEM bonds, it will be a big technical driver of performance.
Between March 2022 and July 2023, the US Federal Reserve (Fed) raised interest rates by 11 times to slow inflation before hitting the pause button in July 2023. Markets read it as a sign of peaking rates and rallied in the last quarter of 2023. Bonds in particular made a strong comeback; the 10-year Treasury yields fell 69 basis points.
That euphoria has worn off. Recent data showed US inflation remained sticky albeit easing gradually, keeping hopes alive of the Fed cutting rates in June. Meanwhile bonds have erased most of the gains made since December 2023; the 10-year Treasury yield has climbed back to 4.1%. Against the backdrop of higher for longer rates, bonds may be in for another bumpy ride.
That said, it is worth noting that some areas of fixed income have generated strong total returns (higher coupons plus capital gains) in the past year. Generally, the higher-risk bond segment benefited more than the investment grade segment.
Global Emerging Market (GEM) bonds, in particular, appeal for their strong total returns. In 2023, the JP Morgan EMBI Global Diversified Index1 which tracks the total returns for US dollar-denominated debt issued by Emerging Markets’ sovereigns and quasi-sovereign entities rose by 11.1% when other bond indices returned 9.1% at best. GEM bonds continue to have the potential to deliver double digit returns once the Fed starts easing. There are several reasons underpinning our investment thesis.
The unsynchronised rate cycles across regions
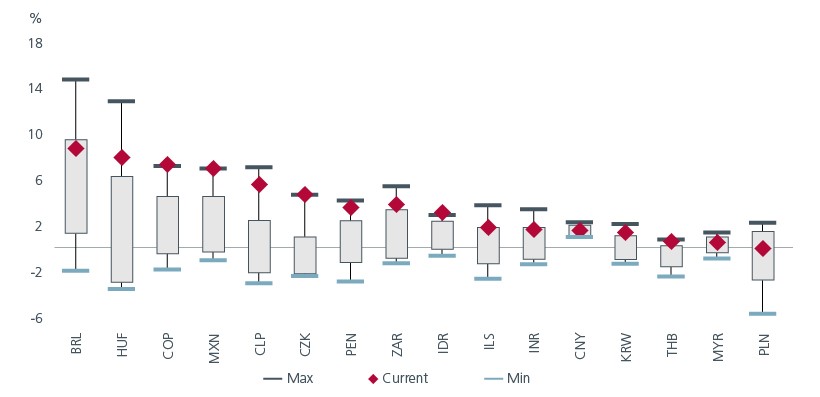
To contain inflation, countries in Latin America (LATAM) started their monetary tightening cycle in March 2021, a year earlier than the US. Rates rose to 11.25% in Chile and Mexico and 13.75% in Brazil, enhancing the coupon rates. By moving faster than the US, Chile and Brazil have been able to slow inflation which enabled their respective central banks to start easing from the second half of 2023. As rates were cut, capital gains boosted overall bond returns. Although the region’s fight against inflation is not over, rate cutting in LATAM should gather pace this year once the Fed eases. Moreover, central banks in the region would likely want to normalise rates after tightening aggressively in the past two years.
Fig 1: Real policy rates remain high in most places

Source: Bloomberg, Barclays Research, November 2023. Refers to policy rates minus 12m ahead inflation expectations.
Over in Asia, inflation is also receding; as per IMF estimates, the average Asian inflation fell from 3.8% in 2022 to 2.6% in 2023. However inflationary pressures in the region were not as high to begin with and Asian central banks did not have to tighten as aggressively as some of their counterparts in other regions. In fact, the US Fed funds rate exceeded the average policy rate in Emerging Asia in the second half of 2023. Despite the benign inflation backdrop, Asian central banks are unlikely to start cutting before the Fed given that foreign currency stability is a key consideration for the Asian countries. Once the Fed starts easing, they will have more scope to cut. Meanwhile, Central and Eastern European, Middle Eastern and African (CEEMEA) countries did not hike as much and hence are not able to cut as inflation is still an issue.
Separately, it appears that markets have priced in rate cuts of 75 basis points cut in the US and 70 basis points in Europe for 2024. But there is still an opportunity to get good returns based on a 24-month view; the average rate cutting cycle in the US over a 24-month period is between 200-300 basis points. Given this historical perspective, adopting a longer-term horizon can result in greater rewards for bond investors.
Supportive fundamentals and technicals
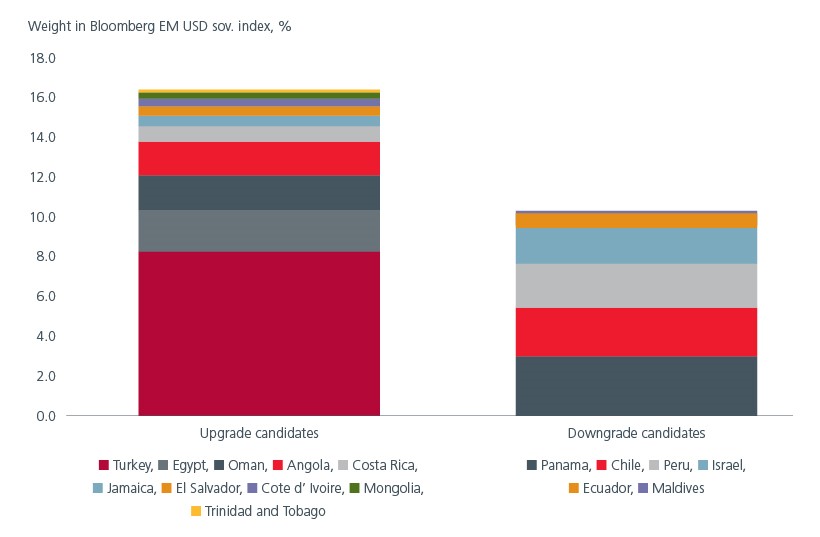
Global growth, estimated at 3.1% in 2023, is projected to remain the same in 2024 before rising modestly to 3.2% in 2025. Developed Market economies are expected to see growth decline slightly to 1.5% in 2024 before rising in 2025, while Emerging Market economies are expected to experience stable and higher growth of 4.1% through 2024 and 2025.2 This growth differential as well as higher fiscal prudence this year suggests that credit rating upgrades are on the cards for some LATAM and CEEMEA countries – all of which are positive for GEM bonds.
Fig 2: Better upgrade/downgrade ratio

Source: Eastspring Investments, Barclays Research, November 2023
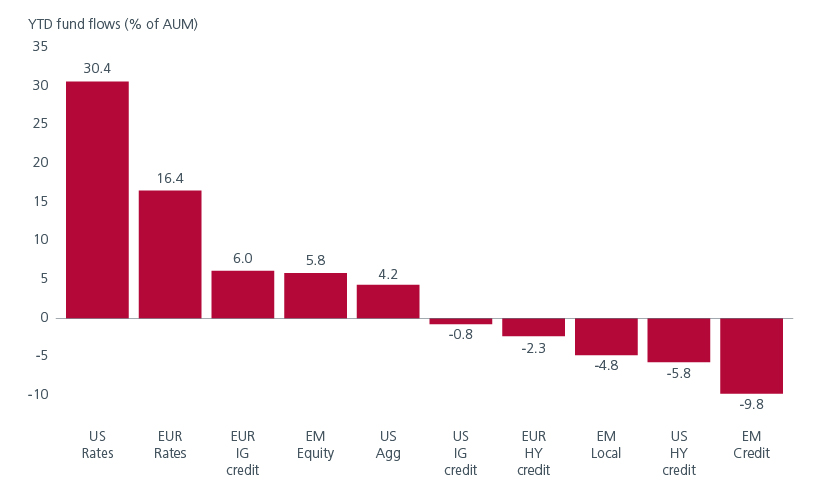
Ultimately the improving credit quality story will trigger a reversal of funds flows from Developed to Emerging Markets. Once the central banks in Developed Markets cut rates, investors will likely move out of money market assets into other asset classes for better returns. Within the bond segment, GEM bonds will be best positioned to benefit from these flows. The size of the money market funds in the US today is approximately USD 6 trillion. Even if only a small portion flows to GEM bonds, it will be a big technical driver of performance.
Fig 3: Potential flow reversal will support GEM bonds

Source: Eastspring Investments, Barclays Research, November 2023. These figures are forecasts.
High carry is a sufficient risk buffer
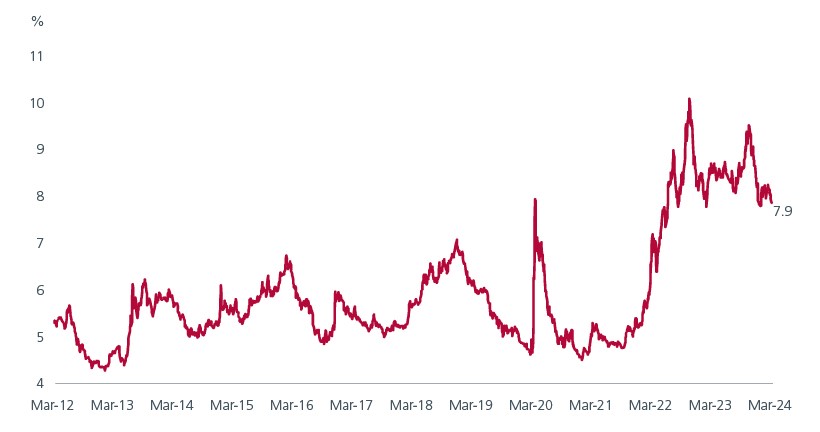
Emerging market yields have risen to 10-year highs post the COVID-induced pricing pressures, the Russia-Ukraine war, and defaults by some countries. Given the improving prospects, the current average yield of 7.9% provides sufficient buffer for any market volatility arising from geopolitical risks. A benign outcome for the ongoing wars in the Middle East and Europe would be a tailwind for GEM bonds.
Fig 4: Yield to maturity of EMBIGD index

Source:J.P. Morgan EMBI Global Diversified Index (EMBIGD) tracks liquid, US Dollar emerging market fixed and floating-rate debt instruments issued by sovereign and quasi-sovereign entities, Eastspring Investments, March 2024
Ample opportunities for active managers
Within the GEM bond universe, investors can access a range of opportunities in more than 70 countries with diversification across hard and local currency, sovereigns and corporates, sectors, credit quality and maturity. Investors are able to enjoy significant yield picks ups since the interest rate cycle differs across the EM regions.
Against the backdrop of a global rate cutting cycle, we believe that duration can also be an attractive play. Currently the GEM government bond index3 has an approximate duration of 7 years while the GEM corporate index4 has a much lower duration of 4 years. Locking in the higher yields today is a good strategy to benefit from the higher carry over a longer period.
Another attractive feature of GEM sovereign debt is the relative safety and liquidity of the asset class which provide investors the opportunity to participate on the upside. At the same time, the expected rating upgrades for some EM countries should add to overall returns. All in the prospects appear brighter for GEM bonds; with investors being paid higher than in the last 10 years to take on EM risks, now seems a good time to buy GEM bonds.
Sources:
1 Regions covered in index are Asia, Latin America and Central and Eastern Europe, Middle East and Africa (CEEMEA)
2 IMF, January 2024
3 EMBIG index
4 CEMBI index
Singapore by Eastspring Investments (Singapore) Limited (UEN: 199407631H)
Australia (for wholesale clients only) by Eastspring Investments (Singapore) Limited (UEN: 199407631H), which is incorporated in Singapore, is exempt from the requirement to hold an Australian financial services licence and is licensed and regulated by the Monetary Authority of Singapore under Singapore laws which differ from Australian laws
Hong Kong by Eastspring Investments (Hong Kong) Limited and has not been reviewed by the Securities and Futures Commission of Hong Kong.
Indonesia by PT Eastspring Investments Indonesia, an investment manager that is licensed, registered and supervised by the Indonesia Financial Services Authority (OJK).
Malaysia by Eastspring Investments Berhad (200001028634/ 531241-U) and Eastspring Al-Wara’ Investments Berhad (200901017585 / 860682-K).
Thailand by Eastspring Asset Management (Thailand) Co., Ltd.
United States of America (for institutional clients only) by Eastspring Investments (Singapore) Limited (UEN: 199407631H), which is incorporated in Singapore and is registered with the U.S Securities and Exchange Commission as a registered investment adviser.
European Economic Area (for professional clients only) and Switzerland (for qualified investors only) by Eastspring Investments (Luxembourg) S.A., 26, Boulevard Royal, 2449 Luxembourg, Grand-Duchy of Luxembourg, registered with the Registre de Commerce et des Sociétés (Luxembourg), Register No B 173737.
Chile (for institutional clients only) by Eastspring Investments (Singapore) Limited (UEN: 199407631H), which is incorporated in Singapore and is licensed and regulated by the Monetary Authority of Singapore under Singapore laws which differ from Chilean laws.
The afore-mentioned entities are hereinafter collectively referred to as Eastspring Investments.
The views and opinions contained herein are those of the author, and may not necessarily represent views expressed or reflected in other Eastspring Investments’ communications. This document is solely for information purposes and does not have any regard to the specific investment objective, financial situation and/or particular needs of any specific persons who may receive this document. This document is not intended as an offer, a solicitation of offer or a recommendation, to deal in shares of securities or any financial instruments. It may not be published, circulated, reproduced or distributed without the prior written consent of Eastspring Investments. Reliance upon information in this document is at the sole discretion of the reader. Please carefully study the related information and/or consult your own professional adviser before investing.
Investment involves risks. Past performance of and the predictions, projections, or forecasts on the economy, securities markets or the economic trends of the markets are not necessarily indicative of the future or likely performance of Eastspring Investments or any of the funds managed by Eastspring Investments.
Information herein is believed to be reliable at time of publication. Data from third party sources may have been used in the preparation of this material and Eastspring Investments has not independently verified, validated or audited such data. Where lawfully permitted, Eastspring Investments does not warrant its completeness or accuracy and is not responsible for error of facts or opinion nor shall be liable for damages arising out of any person’s reliance upon this information. Any opinion or estimate contained in this document may subject to change without notice.
Eastspring Investments companies (excluding joint venture companies) are ultimately wholly owned/indirect subsidiaries of Prudential plc of the United Kingdom. Eastspring Investments companies (including joint venture companies) and Prudential plc are not affiliated in any manner with Prudential Financial, Inc., a company whose principal place of business is in the United States of America or with the Prudential Assurance Company Limited, a subsidiary of M&G plc (a company incorporated in the United Kingdom).


