Executive Summary
- Asian bonds are a resilient asset class, providing stable returns even through equity market volatility.
- Compared to US bonds, Asian bonds have demonstrated a remarkable ability to deliver higher returns at much lower volatility.
- By understanding the unique characteristics of Asian bond markets and applying the right investment strategies, investors can extract alpha and achieve steady returns.
This is the second instalment in our series of articles written to commemorate Eastspring’s 30th anniversary. The articles explore Asia's transformation over the last three decades and share insights from our investment teams, gained through decades of investing in the region.
Less than 30 years ago, Asia was at the centre of the 1997/98 Asian Financial Crisis. This spurred and accelerated the development of bond markets in Asia to the extent the region now has diverse and active local and foreign currency capital markets. Moreover, these markets are set to keep growing each year as the region is home to some of the world’s largest economies and companies, which have risen in global prominence. The supply of corporate credits by Asian issuers has been rising as corporates diversify from traditional bank lending to capital market financing.
On the demand side, Asia’s aging population will continue to drive the demand for fixed income products through pension funds, insurance and even retail channels. Danny Tan, Head of Fixed Income, Eastspring Singapore, highlights that as the size of retirement savings grows, market depth and liquidity will improve. This is crucial for further growth in the Asian bond markets. Meanwhile the breadth of investors has grown; the accessibility for retail bond investors has improved in line with the rising interest and knowledge of bond instruments and the emergence of online investment platforms.
Sustainable bond financing is another area that is witnessing growth. Both issuers and investors alike have proliferated this theme in recent years as Asian countries adopt leading international taxonomies and implement frameworks that help define sustainable activities. Issuers of such bonds have been from the high carbon emitting sectors looking to transition to the low carbon economy.
A growing market
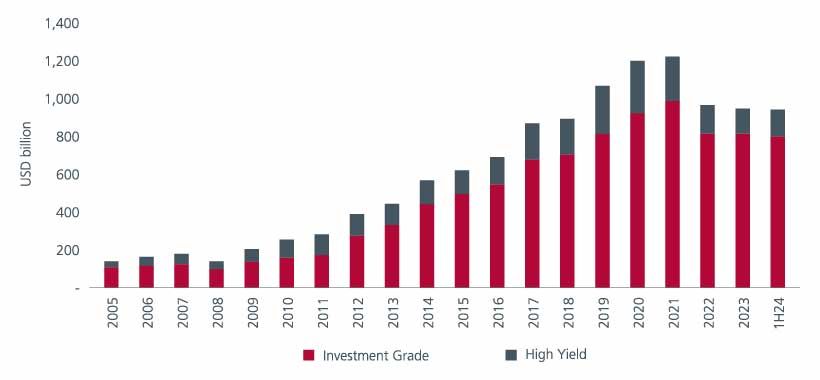
The Asian USD bond market saw rapid growth post-2003 with issuers relatively diversified across Asia until 2010, when China started becoming a key issuer. Notably, market capitalisation of bonds in the JP Morgan Asia Credit Index (JACI) grew 7-fold from 2005 to 1H 2024, as seen in Fig 1. Although market participants are predominantly institutional, there has been increased participation by private banking customers since 2010.
In addition, trading methods of Asian USD bonds have expanded beyond the traditional over-the-counter (OTC) routes as online trading platforms emerged. Danny notes that relative to pre-2008, liquidity is lower now as banks have become capital constrained with respect to proprietary trading. Nonetheless, liquidity is still very abundant for professional investors.
Bond issuances slowed following the 2022 US Fed rate hikes as companies scaled back their expansion plans. The weak Chinese property sector sentiment did not help as well. On the flip side, the reduced supply has lent strong technical support to bond prices.
Fig 1: Market capitalisation of JP Morgan Asia Credit Index

Source: JP Morgan Asia Credit Index (“JACI”) as of 28 June 2024.
Meanwhile the Asian local currency (LCY) markets have also seen a steady expansion in line with the significant efforts to improve the resilience and soundness of the region’s financial systems post the 1998 crisis. Danny points out that although growth has been driven by government bonds, the share of corporate bonds has increased over time.
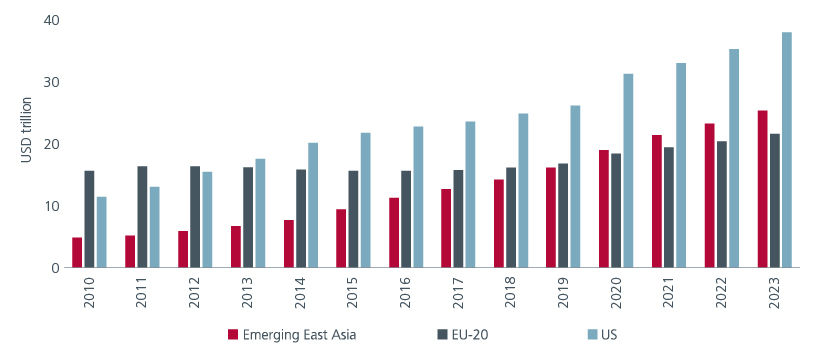
At the end of December 2023, Asia’s LCY bond markets reached a size of USD25.2 trillion, outpacing the year-on-year growth in both the US and Europe. See Fig 2. The three largest markets in terms of size (outstanding LCY bonds) are China, Japan, and Korea. China commands the lion’s share at 58%.
Fig 2: Local currency bonds outstanding by region

Source: Asia Bond Monitor, March 2024, data as of Dec 2023. EU -20 is defined as includes Austria, Belgium, Croatia, Cyprus, Estonia, Finland, France, Germany, Greece, Ireland, Italy, Latvia, Lithuania, Luxembourg, Malta, Netherlands, Portugal, Slovakia, Slovenia, and Spain. Emerging East Asia is defined as Southeast Asia, China, Hong Kong, and Korea.
Time in the market matters
Historically bonds have provided a buffer against equity losses. But over the past 20 to 30 years, the correlation has undergone notable shifts likely due to interest rate movements according to Connie Chou, Head of Fixed Income, Eastspring Taiwan. Although in recent years the correlation has been impacted by the global central banks’ tightening cycles, it is only during extreme times, this correlation changes significantly (e.g. 2013 Taper Tantrum, 2022 Russia-Ukraine tensions) adds Hengky Tambunan, Head of Fixed Income, Eastspring Indonesia.
Currency volatility also impacts the correlation. Hengky points out that both the equity and bond asset classes are heavily influenced by the volatility in the Indonesian Rupiah. Likewise, in Malaysia, both asset classes have been at the mercy of the Ringgit’s downward movements against the US dollar and the Chinese Renminbi.
Looking at the yearly returns of Asian bonds and Asian equities in Fig 3, the notable outliers are 2008 and 2022. Both bonds and equities posted record losses in the 2008 Global Financial Crisis, and in 2022 when the Fed’s aggressive rate hikes caused both asset classes to sell off. Barring these years, the vast majority of returns fall in the top left and right quadrants which suggests that Asian bonds are a rather resilient asset class, providing stable returns even through equity market volatility. Time in the market thus matters, especially for Asian bonds.
Fig 3: Calendar year returns of Asian equities and Asian bonds

Source: Eastspring Investments, MSCI Asia ex Japan index and JP Morgan Asia Credit index, Dec 2023. Reference period is from 2006 to 2023.
Attractive risk-reward opportunities
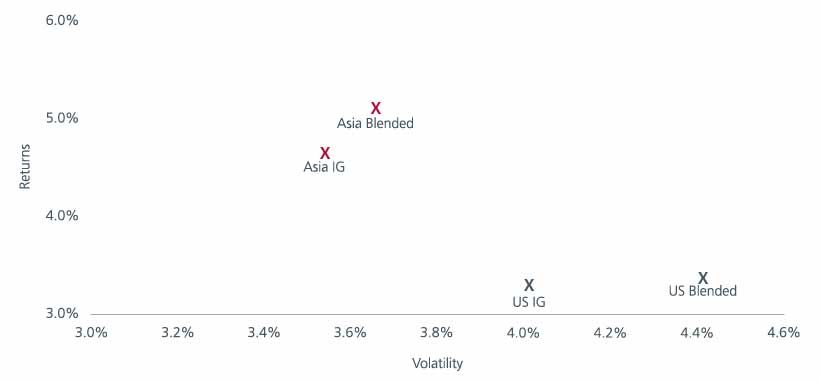
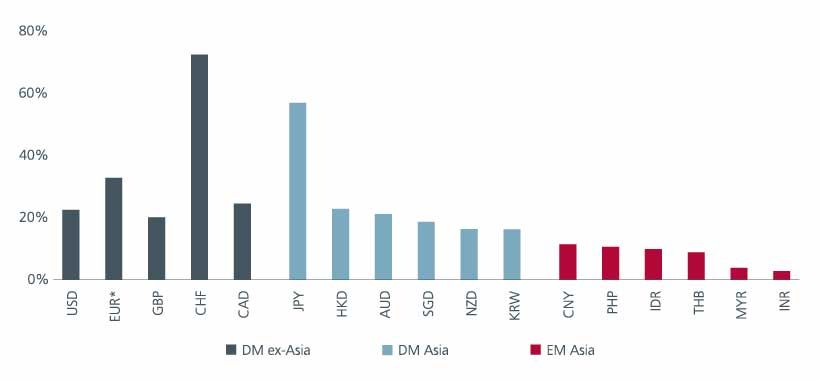
Compared to US bonds, Asian bonds have also demonstrated a remarkable ability to deliver higher returns at much lower volatility. See Fig 4. Equally, Asian local rates have also shown low volatility in the present environment, in contrast to certain hard currency rates such as USD and EUR, as seen in Fig 5.
Fig 4: Returns versus volatility of Asian and US bonds

Source: Eastspring Investments, as of 30 June 2024. Volatility is average 90-day volatility from 2005 to 2023. Return is average annual return from 2005 to 2023. Asia Blended: JP Morgan Asia Credit Index, Asia IG: JP Morgan Asia Credit Investment Grade sub-Index. US Blended: ICE BofAML US Corporate & Government Index, US IG: Bloomberg Barclays US Aggregate Bond Index.
Fig 5: Rate volatility across Asian currencies and hard currencies

Source: Eastspring Investments, as of 30 June 2024. For all currencies, annualised 30-day volatility of respective 5-year government bond yield to maturity is referenced. *For EUR, 5-year government bond referenced is German Bundesobligation. Developed Markets: DM, Emerging Markets: EM.
As such, Asian currency bonds are increasingly being used by Asian governments and corporates alike to take advantage of the region’s low-rate volatility. According to Danny, the Asian local currency markets can be characterised as rates and foreign exchange driven, rather than credit driven.
Why we continue to like Asian bonds
The economic reforms over the last decade and the improving quality of information from issuers have made fixed income investments in the region increasingly attractive. Investors outside of Asia are also gaining a better understanding of Asian markets and are more open to consider investing in Asia, including in local currency bonds. Investors have also turned to Asian bond markets in search of higher and better-quality yields.
Asian high yield (HY) corporates, for example, offer more than 270 basis points pick up over US high yield corporates1. Looking at yield per effective duration as a measure of yield quality, the difference is even more striking, with Asian HY corporates at 340 bps per unit duration, more than triple the yield per duration of US HY at 94 bps per unit duration.
Asia also appeals from a diversification angle, with each market offering a different opportunity set for investors. Malaysia, for example, has a unique and mature Islamic bond (sukuk) market that is the most diverse and largest globally2. Choong Kuan Lum, Head of Fixed Income, Eastspring Malaysia points out that globally, Malaysia has the highest share (c. 40%) of outstanding sukuk, followed by Saudi Arabia, Indonesia, UAE, and Turkey.
According to Wai Mei Leong, Portfolio Manager, Eastspring Singapore, there are also early signs of further diversification anticipated as Japanese and Australian issuers are issuing more in the USD bond market, approaching investors in Singapore and Hong Kong where the main Asian-centric investors sit.
Extracting alpha amid growth and challenges
The region’s different economic and rating profiles, unsynchronised rate cycles, and fluctuating local currencies offer dynamic exploitable bond opportunities. Despite the evolving Asian fixed income landscape, our fixed income teams maintain that the way to extract alpha remains unchanged: a combination of deep expertise in credit assessment, agile positioning in response to local and global macro signals, and careful portfolio construction alongside comprehensive and judicious risk management.
Given the idiosyncrasies in each market, Asian bond investors have to know their markets and credits. Connie highlights that even in a low-yielding market such as Taiwan, by understanding the market’s unique characteristics and applying the right investment strategies, investors can still extract alpha and achieve steady returns.
Investors’ yield curve and duration positioning also plays a significant role in the way to extract alpha. While tactical duration plays were used in the past, curve positioning is more significant to total return in the present environment. Choong Kuan adds that with credit spreads being tight, hunting for high quality yield pickup in corporate bonds has become a principal component of portfolio construction, emphasising the need for expertise in credit selection. With yields presently at all-time highs, we do not have to go significantly down the credit quality spectrum to reach higher absolute yields.
Sources:
1 Bloomberg, Eastspring Investments, BofAML, Citigroup, Markit iBoxx as 30 June 2024. Asian HY Corp as represented by BofA Merrill Lynch Asian Dollar High Yield Corp Index. US HY Corp as represented by BofA Merrill Lynch US Corp and High Yield Indices respectively, Average yield for corporate bonds are based on yield to worst.
2 “Sukuk Rating Profile Enhanced on Sovereign Upgrades; GCC DCM to Cross USD1 Trillion”, Fitch Ratings (2024).
Singapore by Eastspring Investments (Singapore) Limited (UEN: 199407631H)
Australia (for wholesale clients only) by Eastspring Investments (Singapore) Limited (UEN: 199407631H), which is incorporated in Singapore, is exempt from the requirement to hold an Australian financial services licence and is licensed and regulated by the Monetary Authority of Singapore under Singapore laws which differ from Australian laws
Hong Kong by Eastspring Investments (Hong Kong) Limited and has not been reviewed by the Securities and Futures Commission of Hong Kong.
Indonesia by PT Eastspring Investments Indonesia, an investment manager that is licensed, registered and supervised by the Indonesia Financial Services Authority (OJK).
Malaysia by Eastspring Investments Berhad (200001028634/ 531241-U) and Eastspring Al-Wara’ Investments Berhad (200901017585 / 860682-K).
Thailand by Eastspring Asset Management (Thailand) Co., Ltd.
United States of America (for institutional clients only) by Eastspring Investments (Singapore) Limited (UEN: 199407631H), which is incorporated in Singapore and is registered with the U.S Securities and Exchange Commission as a registered investment adviser.
European Economic Area (for professional clients only) and Switzerland (for qualified investors only) by Eastspring Investments (Luxembourg) S.A., 26, Boulevard Royal, 2449 Luxembourg, Grand-Duchy of Luxembourg, registered with the Registre de Commerce et des Sociétés (Luxembourg), Register No B 173737.
Chile (for institutional clients only) by Eastspring Investments (Singapore) Limited (UEN: 199407631H), which is incorporated in Singapore and is licensed and regulated by the Monetary Authority of Singapore under Singapore laws which differ from Chilean laws.
The afore-mentioned entities are hereinafter collectively referred to as Eastspring Investments.
The views and opinions contained herein are those of the author, and may not necessarily represent views expressed or reflected in other Eastspring Investments’ communications. This document is solely for information purposes and does not have any regard to the specific investment objective, financial situation and/or particular needs of any specific persons who may receive this document. This document is not intended as an offer, a solicitation of offer or a recommendation, to deal in shares of securities or any financial instruments. It may not be published, circulated, reproduced or distributed without the prior written consent of Eastspring Investments. Reliance upon information in this document is at the sole discretion of the reader. Please carefully study the related information and/or consult your own professional adviser before investing.
Investment involves risks. Past performance of and the predictions, projections, or forecasts on the economy, securities markets or the economic trends of the markets are not necessarily indicative of the future or likely performance of Eastspring Investments or any of the funds managed by Eastspring Investments.
Information herein is believed to be reliable at time of publication. Data from third party sources may have been used in the preparation of this material and Eastspring Investments has not independently verified, validated or audited such data. Where lawfully permitted, Eastspring Investments does not warrant its completeness or accuracy and is not responsible for error of facts or opinion nor shall be liable for damages arising out of any person’s reliance upon this information. Any opinion or estimate contained in this document may subject to change without notice.
Eastspring Investments companies (excluding joint venture companies) are ultimately wholly owned/indirect subsidiaries of Prudential plc of the United Kingdom. Eastspring Investments companies (including joint venture companies) and Prudential plc are not affiliated in any manner with Prudential Financial, Inc., a company whose principal place of business is in the United States of America or with the Prudential Assurance Company Limited, a subsidiary of M&G plc (a company incorporated in the United Kingdom).


