Executive Summary
- Emerging Markets’ long-term growth premium remains fairly robust and on an upward trend relative to Developed Markets
- Growth in earnings per share in Emerging Markets is growing faster than in Developed Markets for the first time in a decade
- Emerging Market equities are under owned and attractively valued on both absolute and relative basis to Developed Markets
Emerging Market (EM) equities have lagged Developed Market (DM) equities since 2010. The justification for this persistent relative performance has been very well debated, with conclusions often validated by the superior earnings delivery of DMs through a period of low global interest rates, lower growth, and lower inflation. This has also been an extended period of decline for global capital expenditure and real investment, which has been to the detriment of EM equities.
Looking ahead, we believe we are in the initial stages of a substantial structural change in the global economy. At the same time, EMs are benefiting from a convergence of positive factors. This can lead us into the next bull cycle for EM equities.
Long-term growth premium in EMs’ favour
Global emerging markets have long allured investors with the promise of participating in superior growth opportunities. The long-term growth premium of EMs over DMs has fluctuated over the last 50 years from as low as 1% to as high as 7% - currently it is around 2%. While the equity market correlation to this growth premium has been debated, what we do know is that from a stock picker’s perspective, higher growth idiosyncratic markets can offer many attractive opportunities to make money for investors especially when the growth premium is increasing.
The components of a country’s GDP are consumption, investment, government spending and net exports. Looking forward for the next few years, we observe that all these components for this continued growth premium remain fairly robust across EMs and on an upward trend relative to DMs. Consensus data predict EMs to grow by around 5% on the whole. This growth will be backed by robust consumption from strong demographics and income growth, rising capital expenditure, higher government spending on infrastructure and solid manufacturing activity that supports global trade. This bodes well for investment opportunities in EM equities.
Fig 1: EMs typically outperform DMs when their growth gap widens

Source: Factset, Goldman Sachs, MSCI Emerging Markets (EM) and MSCI World (DM) as of 26 Aug 2024
Capital expenditure and earnings pick up in EMs
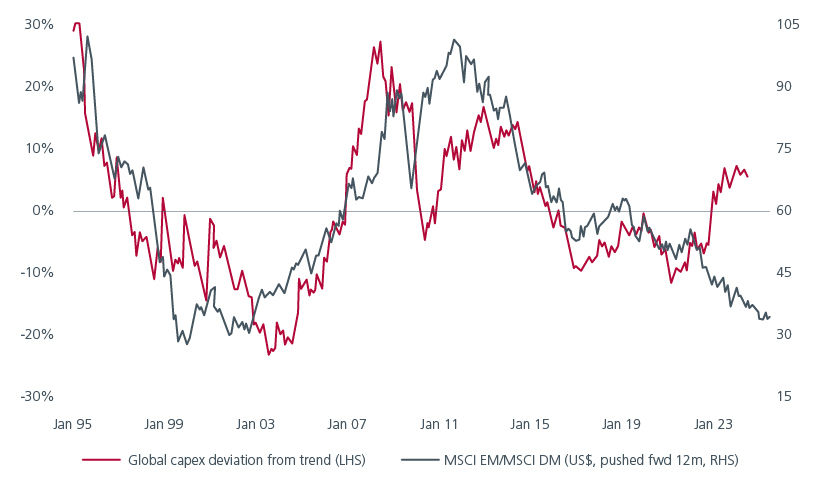
One key headwind for EMs since 2010 has been the declining capital expenditure trend. Post the 2008 Global Financial Crisis, corporates globally reduced their long-term capital expenditure plans in view of the low growth environment. This correlated with a deterioration in earnings outcomes for EM equities. On the other hand, DM equities benefitted from a focus to improve the return on equity and earnings delivery which in turn supported their extended rally.
However, since late 2020, we have seen corporates, and governments worldwide, renew their focus on capital expenditure (capex) and infrastructure spending. Fig 2. It will take time to catch up with a decade of underinvestment, but the impact can already be seen as earnings in EMs are growing faster than in DMs for the first time in a decade - and this is set to continue; in 2024, growth in earnings per share in EMs is 22% versus 8% for DMs.
Fig 2: EMs tend to outperform as capex increases

Source: CLSA, Datastream Refinitiv, MSCI Emerging Markets (EM) and MSCI World (DM) as of 30 June 2024
Apart from capex and earnings, the push for improved governance among listed companies may be gaining momentum especially in Asia following the success seen in Japan from a raft of corporate governance improvements over the last decade or two.
This move can potentially drive improved shareholder returns. The South Korean government, for example, is driving policy to support company share prices that trade at substantial discounts to motivate value realisation both for the benefit of investors as well as their own pension funds. We are also seeing regulatory support in India for corporate efficiency and in China’s state-owned enterprises.
Tailwinds from Fed rate cuts and China stimulus
The Fed’s recent outsized rate cut also bodes well for EMs. Fed rate cutting cycles have historically correlated positively with the outperformance of EM equities. While interest rates will continue to be cyclical, the new base level for the next decade is likely to be structurally higher as the governments and corporates of the world look to diversify supply chains away from cheaper markets towards those that are deemed as more secure and closer to home.
Another tailwind is the potentially weaker US dollar as the US Fed continues to ease rates. A weaker US dollar has also been correlated with stronger EM equities’ performance as the purchasing power of EMs’ domestic currencies improve and all US dollar debt financing becomes relatively cheaper. It is also a commonly used barometer for international investors, reflected by positive flows into EMs during periods of a weaker US dollar.
China is front of mind for any investor in EM equities. Market sentiment has been hit hard by a combination of China’s slow recovery from COVID, the property sector collapse unwinding slowly, lack of effective stimulus measures and geopolitical tensions with trade tariffs in the headlines. However, the recent US-led rate cut cycle opened a window of opportunity for China to launch pro-growth policies. The latest support package for the property and stock markets marks the first major co-ordinated easing in years.
While a real improvement in fundamentals will be needed to sustain a medium-term uptrend, we believe Chinese equities remain a highly investable opportunity and are selectively picking up some incredibly good companies at very attractive valuations. But we also acknowledge that some investors want to separate China from the Emerging Markets equity investment decision, and we have discussed the Emerging Markets ex China opportunity in a note out earlier this year.
Valuations are extremely attractive as sentiment is yet to shift
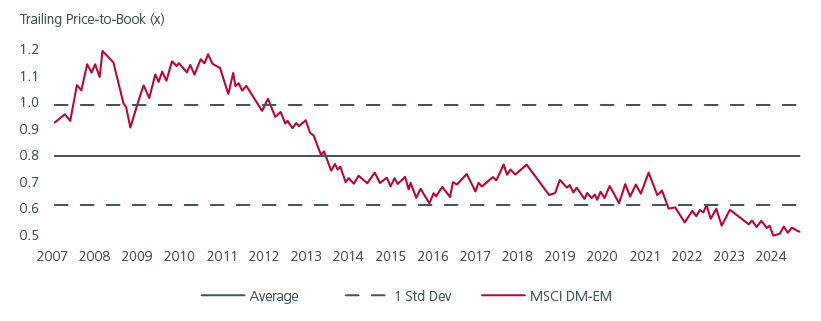
From an investor’s total return perspective, the most important metric when investing in EMs is valuation. History confirms that buying cheap assets gives you the best tailwind for long-term equity returns. EM equities are under owned, and valuations remain attractive on both absolute basis and relative to DMs.
Fig 3. EMs offer an excellent entry point at current value

Source: Datastream Refinitiv, MSCI Emerging Markets (EM) and MSCI World (DM) as of 30 Aug 2024
Very importantly for a stock picking approach, the dispersion between expensive and cheap stocks today is at extremes. This reflects both a risk and opportunity for investing in this market. If you buy an Index ETF for example, you get all the expensive stocks together with the cheap, diluting the potential for higher returns. If you invest via an active manager with a bottom-up approach they can identify many great companies at extremely attractive valuations.
Looking within the dispersion of stock valuations you will see clearly that some of the popular thematic growth and quality stocks are extremely expensive while there are many great valuation opportunities in less well-known parts of the market. This is where a valuation-focused approach can benefit your investment outcomes.
Singapore by Eastspring Investments (Singapore) Limited (UEN: 199407631H)
Australia (for wholesale clients only) by Eastspring Investments (Singapore) Limited (UEN: 199407631H), which is incorporated in Singapore, is exempt from the requirement to hold an Australian financial services licence and is licensed and regulated by the Monetary Authority of Singapore under Singapore laws which differ from Australian laws
Hong Kong by Eastspring Investments (Hong Kong) Limited and has not been reviewed by the Securities and Futures Commission of Hong Kong.
Indonesia by PT Eastspring Investments Indonesia, an investment manager that is licensed, registered and supervised by the Indonesia Financial Services Authority (OJK).
Malaysia by Eastspring Investments Berhad (200001028634/ 531241-U) and Eastspring Al-Wara’ Investments Berhad (200901017585 / 860682-K) and has not been reviewed by Securities Commission of Malaysia.
Thailand by Eastspring Asset Management (Thailand) Co., Ltd.
United States of America (for institutional clients only) by Eastspring Investments (Singapore) Limited (UEN: 199407631H), which is incorporated in Singapore and is registered with the U.S Securities and Exchange Commission as a registered investment adviser.
European Economic Area (for professional clients only) and Switzerland (for qualified investors only) by Eastspring Investments (Luxembourg) S.A., 26, Boulevard Royal, 2449 Luxembourg, Grand-Duchy of Luxembourg, registered with the Registre de Commerce et des Sociétés (Luxembourg), Register No B 173737.
Chile (for institutional clients only) by Eastspring Investments (Singapore) Limited (UEN: 199407631H), which is incorporated in Singapore and is licensed and regulated by the Monetary Authority of Singapore under Singapore laws which differ from Chilean laws.
The afore-mentioned entities are hereinafter collectively referred to as Eastspring Investments.
The views and opinions contained herein are those of the author, and may not necessarily represent views expressed or reflected in other Eastspring Investments’ communications. This document is solely for information purposes and does not have any regard to the specific investment objective, financial situation and/or particular needs of any specific persons who may receive this document. This document is not intended as an offer, a solicitation of offer or a recommendation, to deal in shares of securities or any financial instruments. It may not be published, circulated, reproduced or distributed without the prior written consent of Eastspring Investments. Reliance upon information in this document is at the sole discretion of the reader. Please carefully study the related information and/or consult your own professional adviser before investing.
Investment involves risks. Past performance of and the predictions, projections, or forecasts on the economy, securities markets or the economic trends of the markets are not necessarily indicative of the future or likely performance of Eastspring Investments or any of the funds managed by Eastspring Investments.
Information herein is believed to be reliable at time of publication. Data from third party sources may have been used in the preparation of this material and Eastspring Investments has not independently verified, validated or audited such data. Where lawfully permitted, Eastspring Investments does not warrant its completeness or accuracy and is not responsible for error of facts or opinion nor shall be liable for damages arising out of any person’s reliance upon this information. Any opinion or estimate contained in this document may subject to change without notice.
Eastspring Investments companies (excluding joint venture companies) are ultimately wholly owned/indirect subsidiaries of Prudential plc of the United Kingdom. Eastspring Investments companies (including joint venture companies) and Prudential plc are not affiliated in any manner with Prudential Financial, Inc., a company whose principal place of business is in the United States of America or with the Prudential Assurance Company Limited, a subsidiary of M&G plc (a company incorporated in the United Kingdom).


