Summary
The beauty of the emerging markets is that there is no uniform narrative. The region includes commodity and goods exporters, as well as service-based economies with varying growth, inflation, and earnings prospects. When investors tap the entire emerging market universe, they enjoy a wider and more differentiated opportunity set, which raises the potential for superior risk adjusted returns over the long term.
Asian investors and/or investors who already have exposure to Asian equities may question the need to have a global emerging market (GEM) allocation. Afterall, Asia accounts for 78% of the MSCI Emerging Market (EM) Index although a large part of this exposure comes from China, which makes up almost 30% of the index1 .
A wider opportunity set provides a larger universe for the discovery of mispriced companies, which can positively impact returns over the long term. Our quest to identify the most promising companies within the GEMs often lead us outside of Emerging Asia to other emerging regions such as Emerging Europe, Middle East and Africa (EMEA) as well as Latin America. Fig. 1. shows that there have been instances when the markets in these regions have delivered strong returns, and that opportunities shift across geographies over time.
Fig. 1. Yearly returns of emerging markets

Source: Bloomberg. MSCI Indices in USD terms.
Seeking greater diversification
Each EM has its own set of macro, policy, and market characteristics, as well as challenges and strengths. While China has historically been an important driver of the EMs and will remain so, its influence is tapering as China’s growth moderates, and it adopts an increasingly domestic-driven growth policy. This potentially creates more idiosyncratic and diversified opportunities for bottom-up stock pickers.
When comparing regional indices, the other emerging regions may offer opportunities in sectors which are under-represented in Asia. For example, while the financials and technology sectors have significant weight in the MSCI AC Asia Index, the materials and consumer staples sectors have higher weightings in the MSCI EM Latin America Index. Meanwhile, the communications and energy sectors feature more prominently in the MSCI Emerging EMEA Index. Fig. 2.
Fig. 2. Sector breakdowns
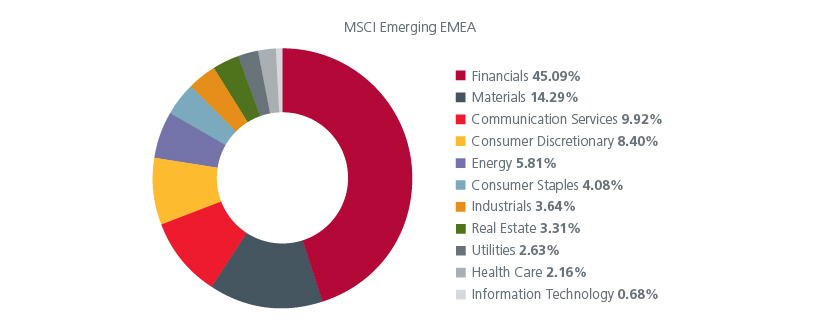
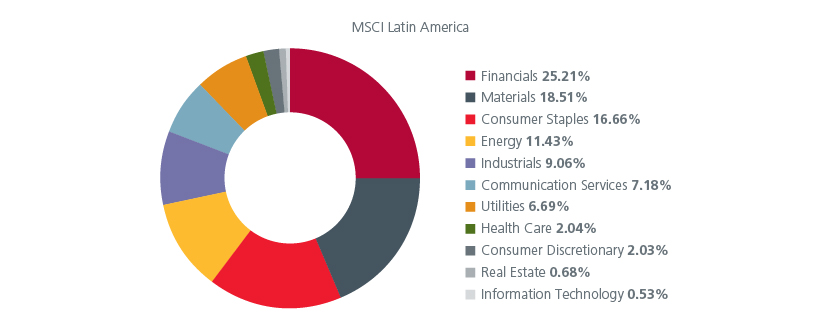
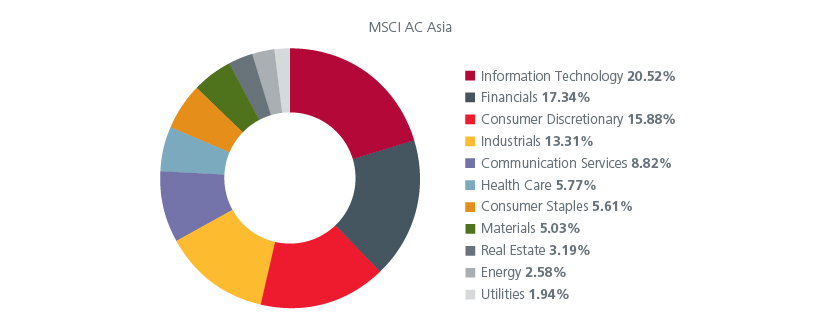
Source: MSCI. June 2023.
For Asian investors who have large exposures to their domestic markets, it is worth noting that the equity markets in Japan, Indonesia, China, Malaysia, and Thailand have the lowest correlations (<0.6) to the MSCI EM Index. Fig. 3. Hence, a broader GEM allocation can provide significant diversification to investors from these countries. In terms of sector exposures when compared against the MSCI EM Index, the Singapore, Malaysia, and Indonesia markets have higher exposures to financials while the Korea and Taiwan markets have a clear technology bias.
Fig. 3. 10-year correlation of MSCI Indices versus MSCI EM Index
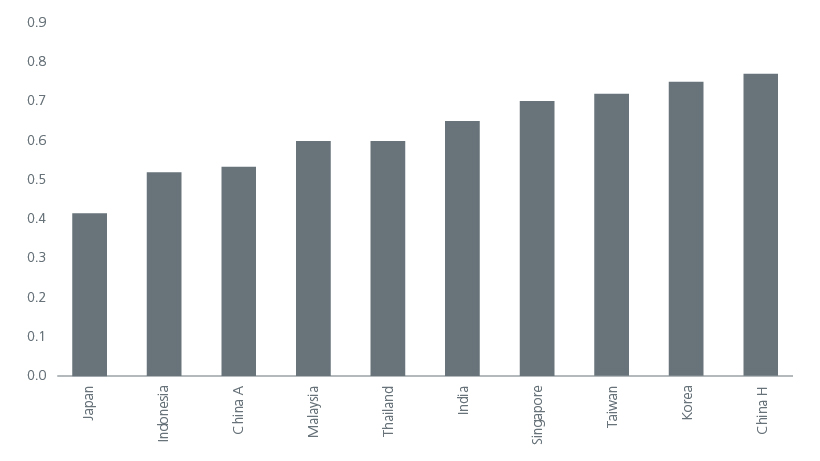
Source: Morningstar Direct. Jan 2013 to Dec 2022.
Structural boosts
Structural trends such as decarbonisation will create and destroy value globally. Investors need to be positioned to take advantage of the opportunities while navigating the challenges.
Nearly 100 countries, contributing over 75 percent of greenhouse global emissions (GHG), alongside roughly 7,500 companies and 1,100 cities, have announced a target to reach net-zero emissions2 . As shared in an earlier article, GEMs are well place to benefit from the green transition theme.
While Emerging Asia benefits from these two trends, selected GEMs outside of Asia have unique advantages which can create attractive opportunities for investors. For example, the path to net zero globally will require significant transition capital expenditure (“green capex”), benefitting the commodity-rich emerging countries. The rapid expansion of global power grids will drive copper demand while the increasing adoption of EVs should boost the demand for aluminium and rare earth minerals. The growing reliance on wind energy would also support prices of copper and rare earth minerals. Fig. 4. While Indonesia holds the world's largest nickel reserves (22% of global reserves) and China currently produces more than 60% of the world’s graphite and rare earths, a large percentage of the world’s production of cobalt, platinum, and copper lie in emerging countries outside of Asia. With most of Asia being commodity importers, an exposure to the commodity-rich countries within Latin America and the EMEA regions can potentially provide some buffer in periods of rising commodity prices.
Fig. 4. Critical minerals* needed for clean energy technologies
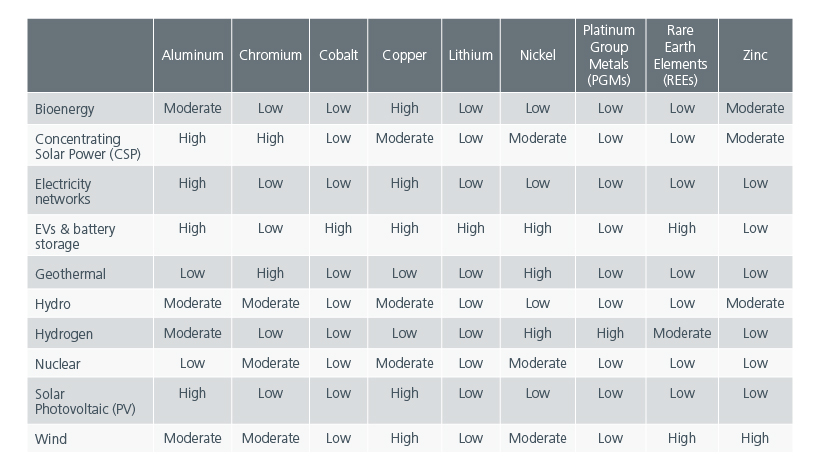
Source: IEA. *relative importance for a particular clean energy technology.
Shifts in the global supply chain are also underway driven by geopolitical tensions, regulatory changes as well as the desire for greater supply chain resilience and in some instances, improved cost competitiveness. An increasing number of US and European companies have accelerated friend shoring or nearshoring of their supply chains. Others have adopted a China plus one strategy by diversifying and setting up manufacturing facilities in additional locations.
Mexico’s proximity to the US, its robust manufacturing capability and ample labour make it an ideal near shoring candidate for US companies. Mexico also benefits from the United States-Mexico-Canada Agreement (USMCA) and US’s Inflation Reduction Act. Latin America’s rich reserves of lithium and copper, which are key inputs for Electric Vehicles (EVs) and renewable energy, makes the region an increasingly attractive destination for foreign investments. Meanwhile, the competitive manufacturing bases in the CE3 countries (Poland, Hungary, Czech Republic) and Turkey are likely to attract nearshoring opportunities especially from the advanced European countries.
The reallocation of Foreign Direct Investments (FDI) flows arising from the global supply chain shifts will be uneven and create winners and losers2 . Geopolitical tensions and more inward-looking policies globally have seen FDI to and from China decline, although the persistent effect of the COVID-19 pandemic and prolonged lockdowns may have also contributed. The bottom row of Fig. 5 shows that Latin America and Emerging Europe have been beneficiaries of outward FDI from the US. FDI inflows is important for the emerging economies as it can create jobs and encourage capital formation, as well as bring about technologies and productivity enhancing management practices. This should have a positive spill over impact on the economies and companies.
Fig. 5. Foreign Direct Investment Reallocation across regions (2Q2020 to 4Q2022 versus 1Q2015 to 1Q2020) – measures percentage point deviation from aggregate change
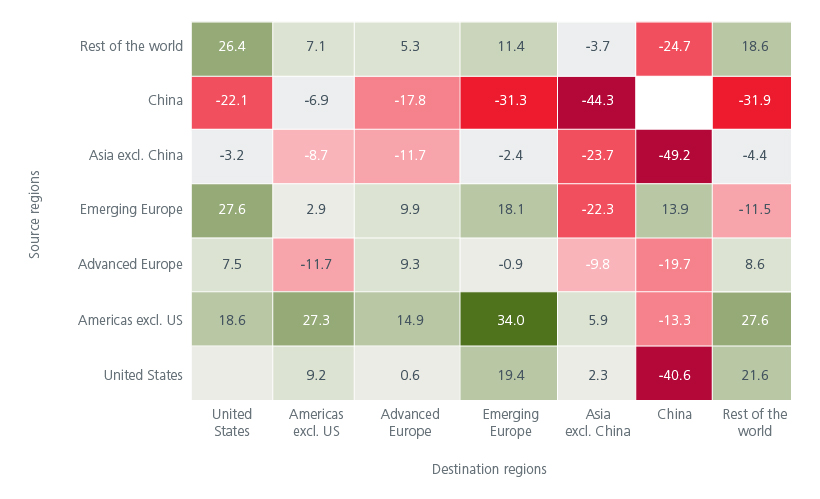
Source: fDi Markets; and IMF staff calculations. Note: Figure shows deviation of regional foreign direct investment change from aggregate change (19.5% decline). Changes are computed using the number of greenfield foreign direct investments in 2020:Q2 – 2022:Q4 and average number in 2015:Q1 – 2020:Q1. Green (red) shading denotes positive (negative) numbers. Excl. = excluding.
No uniform narrative within EMs
The beauty of the EMs is that there is no uniform narrative. Commodity and goods exporters, as well as service-based economies lie within the mix. Countries’ growth and inflation prospects vary, impacting earnings. Geography and diplomatic relations with China and the west also impact countries differently. The reshaping of global supply chains along geopolitical lines are affecting production and sourcing strategies. The significant amount of transition capital expenditure needed globally will benefit commodity-exporters and those with critical reserves.
The broad EM universe has sufficient diversity to facilitate greater diversification. Investors that tap GEM’s broader universe can enjoy a wider and more differentiated opportunity set. Meanwhile, the higher market volatility of some of the emerging regions outside Asia lends well to an investment process which looks beyond the noise and is fundamentally focused.
Sources:
1 As of July 2023.
2 https://climateactiontracker.org/documents/1083/2022-10-26_StateOfClimateAction2022.pdf
3 World Economic Outlook. A Rocky Recovery. 2023 April.
Singapore by Eastspring Investments (Singapore) Limited (UEN: 199407631H)
Australia (for wholesale clients only) by Eastspring Investments (Singapore) Limited (UEN: 199407631H), which is incorporated in Singapore, is exempt from the requirement to hold an Australian financial services licence and is licensed and regulated by the Monetary Authority of Singapore under Singapore laws which differ from Australian laws
Hong Kong by Eastspring Investments (Hong Kong) Limited and has not been reviewed by the Securities and Futures Commission of Hong Kong.
Indonesia by PT Eastspring Investments Indonesia, an investment manager that is licensed, registered and supervised by the Indonesia Financial Services Authority (OJK).
Malaysia by Eastspring Investments Berhad (531241-U).
Thailand by Eastspring Asset Management (Thailand) Co., Ltd.
United States of America (for institutional clients only) by Eastspring Investments (Singapore) Limited (UEN: 199407631H), which is incorporated in Singapore and is registered with the U.S Securities and Exchange Commission as a registered investment adviser.
European Economic Area (for professional clients only) and Switzerland (for qualified investors only) by Eastspring Investments (Luxembourg) S.A., 26, Boulevard Royal, 2449 Luxembourg, Grand-Duchy of Luxembourg, registered with the Registre de Commerce et des Sociétés (Luxembourg), Register No B 173737.
Chile (for institutional clients only) by Eastspring Investments (Singapore) Limited (UEN: 199407631H), which is incorporated in Singapore and is licensed and regulated by the Monetary Authority of Singapore under Singapore laws which differ from Chilean laws.
The afore-mentioned entities are hereinafter collectively referred to as Eastspring Investments.
The views and opinions contained herein are those of the author, and may not necessarily represent views expressed or reflected in other Eastspring Investments’ communications. This document is solely for information purposes and does not have any regard to the specific investment objective, financial situation and/or particular needs of any specific persons who may receive this document. This document is not intended as an offer, a solicitation of offer or a recommendation, to deal in shares of securities or any financial instruments. It may not be published, circulated, reproduced or distributed without the prior written consent of Eastspring Investments. Reliance upon information in this document is at the sole discretion of the reader. Please carefully study the related information and/or consult your own professional adviser before investing.
Investment involves risks. Past performance of and the predictions, projections, or forecasts on the economy, securities markets or the economic trends of the markets are not necessarily indicative of the future or likely performance of Eastspring Investments or any of the funds managed by Eastspring Investments.
Information herein is believed to be reliable at time of publication. Data from third party sources may have been used in the preparation of this material and Eastspring Investments has not independently verified, validated or audited such data. Where lawfully permitted, Eastspring Investments does not warrant its completeness or accuracy and is not responsible for error of facts or opinion nor shall be liable for damages arising out of any person’s reliance upon this information. Any opinion or estimate contained in this document may subject to change without notice.
Eastspring Investments companies (excluding joint venture companies) are ultimately wholly owned/indirect subsidiaries of Prudential plc of the United Kingdom. Eastspring Investments companies (including joint venture companies) and Prudential plc are not affiliated in any manner with Prudential Financial, Inc., a company whose principal place of business is in the United States of America or with the Prudential Assurance Company Limited, a subsidiary of M&G plc (a company incorporated in the United Kingdom).


